The Six Sigma approach is a data-driven approach to problem-solving. Since we’re working with data, it is natural that we will work with statistics as you will learn in any reputable Six Sigma Green Belt training. There is one particular statistical term that is critical for Six Sigma and for understanding a process based on Six Sigma principles as briefly taught in free Six Sigma courses. That term is Sigma Level. This is the basis of all Six Sigma projects.
Attend our 100% Online & Self-Paced Free Six Sigma Training.
In this article, we will go through this metric of Six Sigma by looking at its meaning and definition, its correlation between Defects per Million Opportunites (DPMO), and how to calculate it by giving some examples.
What is Sigma Level in Six Sigma?
Let us first understand what the word ‘Sigma’ means. Sigma is a statistical term. It is the symbol of Standard Deviation. Standard Deviation is one of the absolute measures of dispersion or variation in data. Collecting data from a process’ performance will show the variation or Standard Deviation of the process’ performance. Sigma is a measure which uses the characteristic of past data to make judgments about how the process will perform in the future.
Now, let’s look at Sigma Level: it is a high-level baseline metric to understand process capability to meet customer requirements. We use the metric, Defects per Million Opportunities, or DPMO, to calculate the Sigma Level for a product or process. To compare process performance across an entire organization, the Sigma Levels of processes, One Sigma, Two Sigma, Three Sigma, Four Sigma, Six Sigma, etc. have to be determined.
Check our Six Sigma Training Video
Real-world Sigma Level examples
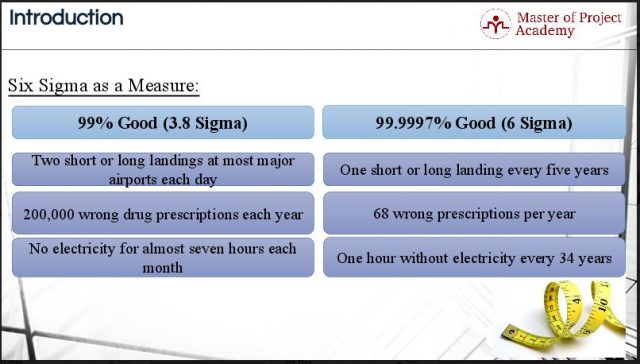
Sometimes statistical terms can seem arbitrary and abstract. When we look at real world examples, the meaning of Sigma Levels becomes quite clear. So what is a good şevel? In a world that operates on a level of 3.8, two short or long landings take place at a major airport per day. In a world that works on a levels of 6, there is only one short or long landing every five years. In a world that operates on a Sigma Level of 3.8, doctors prescribe 200,000 wrong drug prescriptions per year and only 68 per year if it were operating on 6 Sigma Levels. Those are some pretty drastic differences in process performances only 2.2 Sigma Levels apart. Most companies aim for processes operating at a Six Sigma level and based on these real world examples, it is evident to see why.

The correlation between DPMO and Sigma Level
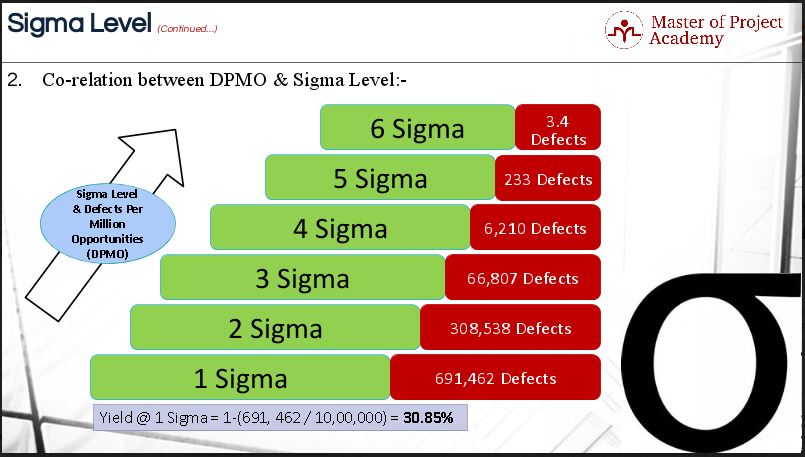
It’s time to review DPMO. DPMO is a long-term measure of the success rate of a process. It specifically looks at the number of defects that a process produces. Since Sigma Level looks at variation in a process and DPMO looks at the rate of producing defects in a process (i.e. outputs that are out of specification) it is natural to conclude that there is a correlation between them. As the DPMO of a process increases, the Sigma level decreases and vice versa. As the level increases, yield increases too. In other words, Sigma level and yield are directly proportional to each other. A quick reminder of the definition of yield – it is the ratio of the number of good products produced vs. the total number of goods produced.

How to calculate the Sigma Level of a process
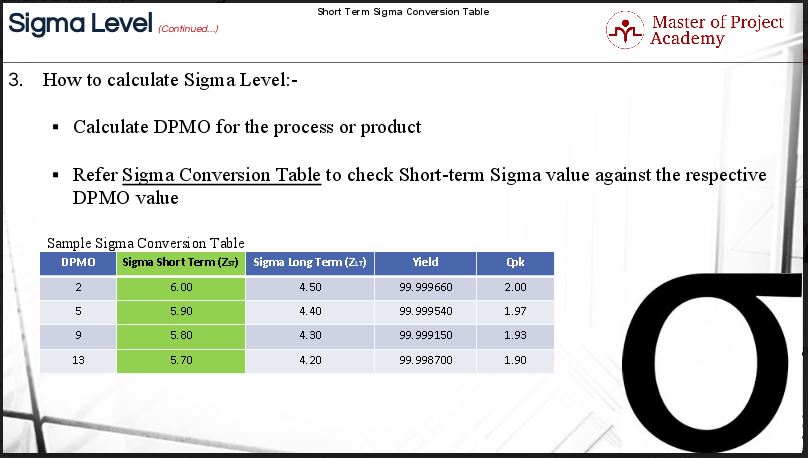
First of all, make sure to calculate the DPMO for your process or product. Once you have the DPMO figures handy, you can refer to the Sigma Conversion table or a Sigma Level calculator to get the corresponding sigma level. You’ll see that the conversion table has a column for Sigma Short Term and Sigma Long Term.

Sigma Short Term
Let’s look at the ‘Sigma Short Term’ column. Why we are referring only to ‘Sigma Short Term’ column? We must understand that the sigma level of a process is an equivalent unilateral figure of merit. The merit here is in terms of Efficiency and Effectiveness of the process under consideration. Therefore, the Sigma Level is always reported as a short-term measure of capability. That is why we are referring only to the ‘Sigma Short Term’ column.
Sigma Long Term
But what about the ‘Sigma Long Term column’? This column goes by the convention established at Motorola where the Six Sigma program originated. According to Motorola, the Sigma Level for any process gets adjusted by 1.5 Sigma-Level to recognize the tendency of processes to shift over the long-term.
CpK
The last column shows values for “Cpk”. This is a measure of process capability. It measures a process’ capability to produce products that are within the specification limits defined by the business based on customer requirements. It also measures how much natural variation occurs within the confines of the specification limits. It is a useful measure for comparing processes in terms of how well the processes are controlled. CpK is important for the Measure phase of the Six Sigma process, so more about that later.
Sigma Levels are the crux of the Six Sigma problem-solving approach. Increasing a process’ levels i.e. reducing its variability and ability to produce errors, is the root of Six Sigma. These levels guide Six Sigma practitioners in their quest to create better and more efficient processes. As you have seen from the real-world examples in this article, operating at a level of Six Sigma makes all the difference.
Review by: Anne Peters


One thought on “Sigma Level : The Most Important Statistical Term in Six Sigma”
Comments are closed.