
The Cause-and-Effect Diagram is one of the Six Sigma 7 QC Tools. It goes by several names, the most popular being a Fishbone Diagram because a completed diagram resembles the skeleton of a fish. It is also sometimes referred to as an Ishikawa Diagram after its creator. Leading online six sigma courses and Lean Six Sigma training all talk about the Fishbone Diagram as it is such an important problem-solving tool for Six Sigma approach.
Attend our 100% Online & Self-Paced Free Six Sigma Training.
According to Six Sigma principles, root causes to problems are identified through a data-driven approach and the Fishbone Diagram is one step towards identifying root causes to problems.
The history
Talking briefly about the history, a professor at the University of Tokyo, Dr. Kaoru Ishikawa, developed the first Fishbone diagram in 1943. The original objective of the diagram was to sort out and depict the relationship among the several factors impacting quality control, wherein the variables that cause dispersion, such as chemical composition, the size of parts, or process workers, were called “factors”. We now call “factors” “causes”.
Organizing causes affecting quality
The quality characteristics described the outcome or effect, such as length, hardness, the percentage of defects, and so on. The Fishbone Diagram helps organize ideas and understand the relationship between potential causes and an effect or a problem by formatting, arranging and organizing potential causes into themes and sub-themes in preparation for a cause identification effort. It helps stimulate thinking when developing the list of the potential sources of a problem. It guides concrete action and tracks the potential causes during an investigation effort to determine whether the item significantly contributes to the problem or not.
Relationships between cause and effects
The relationships between causes and an effect or a problem can be depicted in the form of a Fishbone diagram. The problem is placed in a box or diamond-shape to represent the head of a fish. This represents the “effect” that all the subsequent causes supposedly impact. The cause themes and sub-themes are placed to the left of the problem.
A Fishbone diagram is a focusing tool. It starts with identifying all the ideas for potential causes and then groups or categorizes the potential causes into themes. It is a good tool to use when multiple people (and/or functions) are required to be engaged in the problem-solving effort and many perspectives are supposed to be captured.
Categorization Technique
Let’s have a look at the categorization technique for the purpose of creating a Fishbone Diagram. A standard categorization technique, especially in case of manufacturing industries, is called 5Ms and 1P. It can be used as a checklist to identify potentials causes’ themes:
- Machines. This category refers to the potential causes contributed by equipment, technology etc. The technological causes are mainly related to hardware and/or software
- Methods. This category refers to the potential causes contributed by the process, procedure, approach, policy, practice etc.
- Materials. This category refers to the potential causes contributed raw materials, components, information, or data.
- Measurements. This category refers to the group of potential causes contributed by input and output metrics for quality, quantity, process performance metrics, calibration, inspection etc.
- Mother Nature or Environment. This category includes external as well as workplace factors contributing to the effect under consideration, such as:
o Natural environment, for instance, weather, Acts of God, temperature, humidity etc.
o Physical surroundings (facilities, buildings, plant, workspace, office)
o Management surroundings (organizational, social, political)
o Marketplace - People. This means all stakeholders directly or indirectly involved in the process. For instance, customers, employees, suppliers, partners, and regulators etc.
Example
Please have a look at a Fishbone diagram in the figure below. The question here is: how we are supposed to interpret the diagram? The head of the fish is the effect or business problem under consideration. The effect is Low Call Quality. The objective of the Fishbone Diagram is to explore the potential reasons contributing to the effect of Low Call Quality.
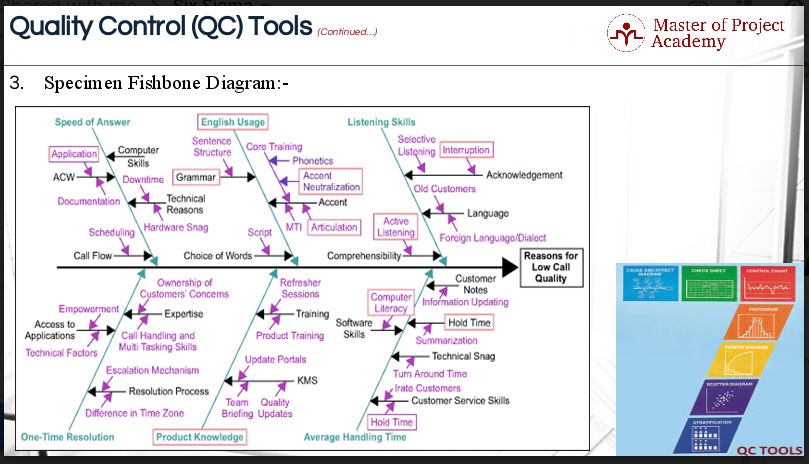
Let us pick up any category of causes, say average handling time or AHT. One of the categories, contributing to low call quality, is average handling time. All of you must be aware but it is one of the metrics for measuring call handling quality in a call center environment. The diagram would deep-dive into potential causes for high AHT. The sub-categories of potential causes are customer service skills, technical snag, hold time and customer notes.
Let’s have a look at first sub-category: Customer Service Skills. According to the team, the poor customer service skill is one of the sub-categories that impacts AHT. The sub-causes for poor customer service skills are the hold time and irate customers. It means the high hold time represents poor customer service skills. Because of the high hold time, the customer may get irate and the call may need to be addressed. The project team may decide to further deep-dive to comprehend multiple scenarios or causes for high hold time. Note that all the potential causes and sub-causes should be viable or feasible or workable. The objectivity cannot be ignored in this exercise. That is how we are supposed to read and execute a fishbone diagram.
How to Construct a Fishbone Diagram?
Let’s try to understand how to construct a Fishbone Diagram with a series of process steps. Refer back to the example of the Fishbone Diagram above as we explain the nine steps to constructing a Fishbone Diagram:
Step 1 in constructing a Fishbone Diagram
The first step is to agree on the topic or problem to be analyzed. For example, a quality characteristic that needs improvement. We are supposed to use data specifically to describe the problem.
Step 2 in constructing a Fishbone Diagram
The second step is to write the specific problematic outcome to the far right edge of the diagram and draw a box around the text to form the “head” of the fish.
Step 3 in constructing a Fishbone Diagram
The third step is to draw a line extending from the left edge of the fish head to the right edge of the diagram. This represents the spine of the Fishbone Diagram.
Step 4 in constructing a Fishbone Diagram
The fourth step is to write down the potential causes of the problem and group related topics. The causes shall be noted on the basis of one’s experience and data too. You can ask the participants to bring completed data collection sheets to the meeting from their respective areas to facilitate brainstorming activities.
Step 5 in constructing a Fishbone Diagram
The fifth step is to name the major themes of each grouping. These could also be referred as high-level process steps.
Step 6 in constructing a Fishbone Diagram
The sixth step is to draw a line extending from the spine for each theme and write the category name at the outermost end of the line. This is the end that is not attached to the spine to represent a “Main” Fishbone.
Step 7 in constructing a Fishbone Diagram
The seventh step is to draw one branch to the main Fishbone for each sub-theme or sub-process steps. Label the end of each branch with the sub-theme name to represent smaller bones and to show the linkage to the “higher level” category with which it is affiliated.
Step 8 in constructing a Fishbone Diagram
The eighth step is to continue the seventh step to drill-down into as much detail as required. Here you are defining more bones and linking the relationships.
Step 9 in constructing a Fishbone Diagram
The ninth step is to review the diagram for completeness and clarity and then modify accordingly. And that is how you draw a Fishbone Diagram!