Quality is a very important feature for successful businesses to uphold and it is the pillar of good project management practices. Six Sigma projects taken on by those who completed an online Six Sigma training program or by Six Sigma Black Belts focus on improving management processes to ensure better quality. It is essential that customers are given products and services that are convenient for them and hence, worth the money they pay. In order to be successful in business, the project team needs to remember that customer satisfaction is always the most important goal for project success.
- Read the comprehensive guide about the Seven QC Tools, providing not just theoretical understanding but also practical insights, real-world examples, and relatable scenarios.
Attend our 100% Online & Self-Paced Free Six Sigma Training.
Customer satisfaction is part of the Six Sigma principles are also briefly taught in free Six Sigma training. To ensure the best possible products and services are sold to customers at a consistent level, businesses should use the Seven Quality Control tools (7 QC Tools). The efficient and effective use of these 7 QC tools can help maintain the consistency of the products and services being produced and it also prevents project failure. The use of these tools as management skills is spread out throughout the different phases of the DMAIC process.
- What is Power BI? We have brand new course offers for you to learn Power BI:
Six Sigma Projects: Why use the 7 QC tools?
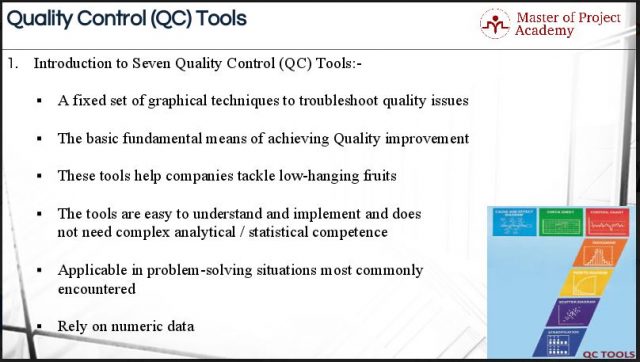
The 7 QC tools is a title given to a fixed set of graphical techniques identified as being most helpful in troubleshooting issues related to quality. The 7 QC tools are fundamental instruments for product quality and process improvement. They are used to examine the production process, identify the key issues, control fluctuations in product quality, and give solutions to avoid future defects.
These are the tools that facilitate the organization to resolve the basic problems. When an organization starts the journey of quality improvements, the organization normally has many low-hanging fruits; which should be tackled with these basic 7 QC tools. These 7 QC tools are easy to understand and implement and do not need complex analytical/ statistical competence.
Lean Six Sigma Projects: What are the 7 QC Tools?
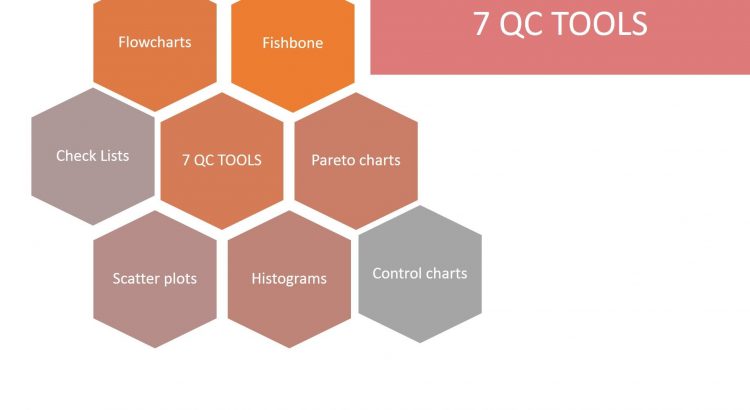
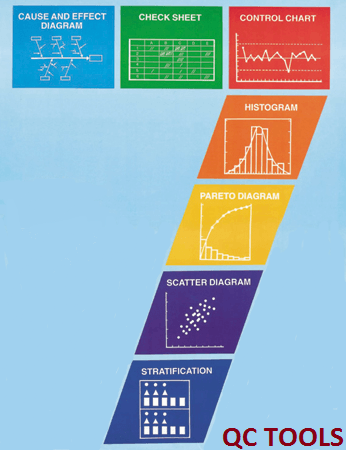
The 7 QC tools as defined by the American Society for Quality (ASQ) and accepted throughout the quality engineering community include:
- Cause-and-Effect Diagrams / Fishbone Diagram
- Pareto charts
- Control Charts
- Scatter diagrams
- Histograms
- Flowcharts
- Checklists
7 QC Tools: Cause-and-effect diagrams
The first of the 7 QC tools is the Fishbone Diagram helps organize ideas and understand the relationship between potential causes and an effect or a problem by formatting, arranging, and organizing potential causes into themes and sub-themes in preparation for a cause identification effort. It helps stimulate thinking when developing the list of the potential sources of a problem. It guides concrete action and tracks the potential causes during an investigation effort to determine whether the item significantly contributes to the problem or not.
Check our Lean Six Sigma Training Video
7 QC Tools: Pareto Charts
The second of the 7 QC tools is the Pareto chart is used to prioritize the contributors which make the biggest impact on a problem, or which represents the largest areas of opportunity. A Pareto chart is a tool to focus attention on priorities while trying to make decisions. It is a good communication tool that describes the data in a simple and easy-to-read bar diagram. The chart helps to study and analyze the frequency of occurrences of an event in a process and identify the biggest contributors. These diagrams communicate the principle of 80:20. It states that 80% of an effect comes from 20% of the causes.
7 QC Tools: Control Chart
The third of the 7 QC tools is the control chart. The best tool to investigate variation in a process is a control chart. A control chart is often called a time series plot that is used to monitor a process over time. It is a plot of a process characteristic, usually through time with statistically determined limits. When used for process monitoring, it helps the user to determine the appropriate type of action to take on the process depending on the degree of variation in the process.
7 QC Tools: Scatter diagrams
The fourth of the 7 QC tools is the scatter diagram. The scatter diagram is also known as a scatter plot or a correlation graph. It helps visualize the relationship between two variables. The graph helps check for outliers too.
7 QC Tools: Histograms
The fifth of the 7 QC tools is the histogram. A histogram is a pictorial representation of a set of data. The histogram is a bar graph that shows the frequency of values. It is created by grouping the measurements into ‘‘cells” or “bins.” Histograms are useful to understand the location, spread, and shape of the data. In addition, potential outliers or missing data can be seen.
7 QC Tools Flow charts
The sixth of the 7 QC tools is the flow chart. A flow chart is a visual representation of a process that can illustrate:
- What activities are completed, by whom, and in what sequence
- Hand-offs between departments or individuals
- Internal and external operational boundaries
7 QC Tools: Checklists
The last of the 7 QC tools is the checklist. The purpose of a checklist is to summarize, and in some cases; graphically depict a tally count of event occurrences. A checklist is used when users are interested in counting the number of occurrences of an event, such as defects or nonconformances. In many instances, a checklist will summarize countable data related to certain types of defects and will provide a rough graphical representation of where, in a part or process, defects occurred.
Six Sigma Projects: When to use the 7 QC Tools?
Collectively, these tools are commonly referred to as the 7 QC tools. In the Define phase of the DMAIC process, Flowcharts are very important. In the Measure phase, the first three of the 7 QC tools are relevant: Fishbone Diagram, Pareto Chart, and Control Charts. In the Analyze phase, the Scatter Diagram, Histogram, and Checklist are relevant. The Control Chart is also relevant in the Improve phase.
Six Sigma Projects: Three key insights regarding the 7 QC Tools
Kaoru Ishikawa, in the year 1985, is credited with making the following statement with respect to these tools:
“As much as 95 percent of all quality-related problems in the factory can be solved with seven fundamental quantitative tools.”
Ishikawa’s statement provides three key insights into these tools, namely that these seven tools are:
- Applicable in problem-solving situations most commonly encountered by Quality Engineers
- Quantitative in nature and rely on with the exception of Flowcharts and Cause-and-Effect diagrams, numerical data
- Most commonly used in quality control to assist in Tracking, Monitoring, and analyzing data
The 7 QC tools are great ways to visualize information relating to problem-solving to improve the quality of processes, products, and services. These tools can be used throughout the DMAIC cycle and also provides evidence of how well the Lean Six Sigma project work has been executed according to its data-driven principles.

2 thoughts on “7 QC Tools for Successful Six Sigma Projects”
Comments are closed.