
The Lean Six Sigma approach is fundamentally data-driven. It relies heavily on statistics to solve real-world problems, especially in the Measure phase and Analyze phases of the DMAIC process. One of the problems that practitioners who have successfully completed Lean Six Sigma Green Belt training face, is determining the probability of defectives resulting from a process. If you would recall from online Six Sigma courses, defectives are products or services that are unusable. In terms of defectives, there can be one of two outcomes – defective or non-defective. To determine the probability of a process delivering defective products one can use the binomial distribution. Let’s take a closer look at the binomial distribution and what it means for Lean Six Sigma.
Attend our 100% Online & Self-Paced Free Six Sigma Training.

The Definition
The binomial distribution was discovered by Bernoulli, J. in 1713, making it one of the oldest known probability distributions. The binomial distribution is a kind of probability distribution for discrete data. It is a probability distribution that summarizes the likelihood that a value will take one of two independent values under a given set of parameters or assumptions.

The binomial distribution is associated with data that can have one of two values for instance: pass or fail, go or no-go etc. It is very useful when Six Sigma teams want to learn more about how often an event would occur, rather than the magnitude of the event. Binomial distribution characterizes defectives data, which are actually non-conformities in products or services that render the product or service unusable. It is simply the percentage of non-defective items.
Binomial Distribution in Six Sigma
Binomial data need to meet the following criteria:
- Each item is the result of identical conditions
- Each item results in one of two possible outcomes (pass/fail, go/no-go)
- The probability of success (or failure) is constant for each item
- The outcomes of the items are independent
Therefore, a binomial distribution is better suited for evaluating defectives than defects. It is best suitable when observations are less than 30 in number and the probability is more than 10%. Project teams can use the binomial distribution to find out how difficult a particular target is to achieve given past performance.
The binomial distribution cannot be used for every situation that only has two outcomes. Consider the question where someone wants to calculate the possibility of whether it will snow on a given day or not. A binomial distribution will not be applicable because the likelihood of snow is less in summer than in winter.
Example
Flipping a coin would create a binomial distribution. This is because each trial can only take one of two values (heads or tails), each success has the same probability, for instance, the probability of flipping a head or tail is 0.50, and the results of one trial will not influence the results of another.
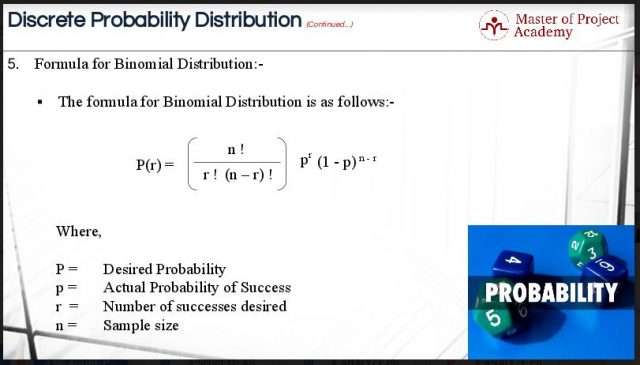
Formula
This figure shows the Binomial Distribution Formula. Let’s take a look at all the elements of the formula.
- ‘P’ stands for probability of success. The capital ‘P’ belongs to the desired probability and the small ‘p’ belongs to the actual probability.
- ‘r’ stands for number of successes desired
- ‘n’ stands for Sample size
- ‘!’ is the symbol for factorial. For e.g. ‘5 Factorial’ would be equivalent to: 5 will be multiplied by 4, 4 will be multiplied by 3, 3 will be multiplied by 2 and 2 will be multiplied by 1. The answer is 120.
- ‘0 Factorial’ is always equal to 1
Example and Solution
We will now go through an illustration. The problem is as follows:
- We know that the tossing of a coin has only two outcomes – head or tail
- Probability of each outcome is 0.5 and it remains fixed over time
- Also, outcomes are statistically independent
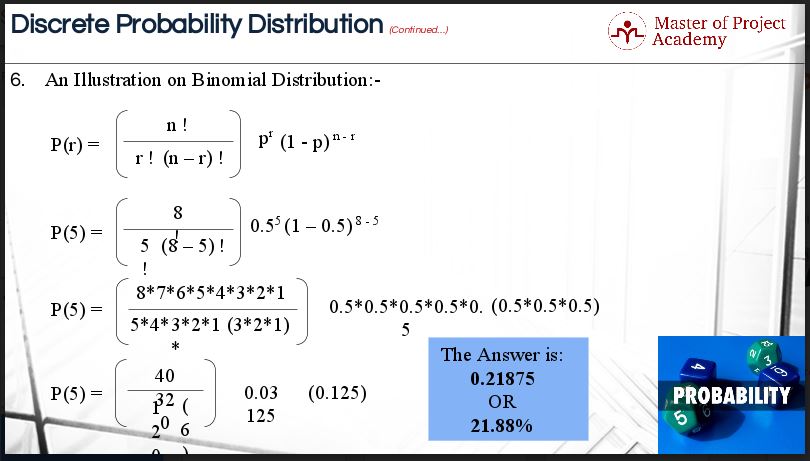
The important question in this example is: What the probability of getting 5 heads; if we toss the coin 8 times?
Let’s use the formula to get the right answer.
- We need to find the probability of getting 5 heads. Therefore; the value of ‘r’ will be 5
- We will toss the coin 8 times. That is why our sample size will be 8
- The probability of getting ‘heads’ is 0.5
The complete information in the figure below is stratified to help comprehend the solution quickly. Look at the values of ‘8 Factorial’, ‘5 Factorial’ and ‘3 Factorial’. Please see the ‘superscript 5’ and ‘superscript 8 minus 5’ of 0.5 in the formula. Once we substitute all values in the formula, the answer that we get is 0.2187 or 21.87%. This is the probability of getting 5 heads; if we toss the coin 8 times using the binomial distribution formula.
Alternative Ways to Calculate Probability with a Binomial Distribution
Another way of determining probability based on the binomial distribution is to use a binomial table. To use this efficient method you need to know the value of x (the desired number of successes). X values are usually listed in the left-most column of the table. The p-values which is the probability of success for any one trial appears in the top row of the table. Find the place where your X-value and your p-value intersect and that is the probability for your trial.
Of course, the easiest way to calculate probability based on a binomial distribution is to use one of the many statistical software packages available. Minitab is commonly used by Six Sigma practitioners to calculate probability based on a variety of distributions, but there are other software packages as well.
Any good Six Sigma practitioner would know the benefits of the binomial distribution in calculating the probability of defective goods being produced. Knowing the probability at which a process will produce defective goods or services gives a data-driven idea of the effectiveness of the process and creates awareness of the benefit of improving said process. It takes the guesswork out of process improvement. Now that you know why the binomial distribution is useful in Six Sigma projects, you can use it on your own data.