In the Measure phase of the DMAIC process in Six Sigma, there are many types of statistical parameters that graduates of Lean Six Sigma Green Belt training or other Online Six Sigma courses should know. Measures of Central Tendency serve to locate the center of the distribution. However, they do not reveal how the items […]
Tag: DMAIC

Measure Phase Control Chart: How to Measure Process Variation?
During the Six Sigma Measure Phase of the DMAIC cycle in the Six Sigma approach to problem-solving, we need to understand the degree of the process variation. The degree of process variation, as you will learn in Lean Six Sigma Green Belt training and also in some of the free Six Sigma courses, tells us how many […]

7 Steps to Create SIPOC Diagram in Six Sigma
In a Six Sigma project, the SIPOC diagram is one of the important tools in the Six Sigma DEFINE phase of the DMAIC framework. In Lean Six Sigma Green Belt course, and even in free Lean Six Sigma course, you will learn that it is an acronym that stands for Suppliers, Inputs, Process, Outputs, and […]

2 Types of Data for Six Sigma Measure Phase
The Six Sigma approach is a data-driven approach to problem-solving. It stands to reason that the people who study in a Lean Six Sigma Green Belt course will be confronted with different data types in Six Sigma measure phase. Even some reputable free Six Sigma Green Belt Certification training will cover different types of data when discussing the […]

10 Steps for Creating a Pareto Chart
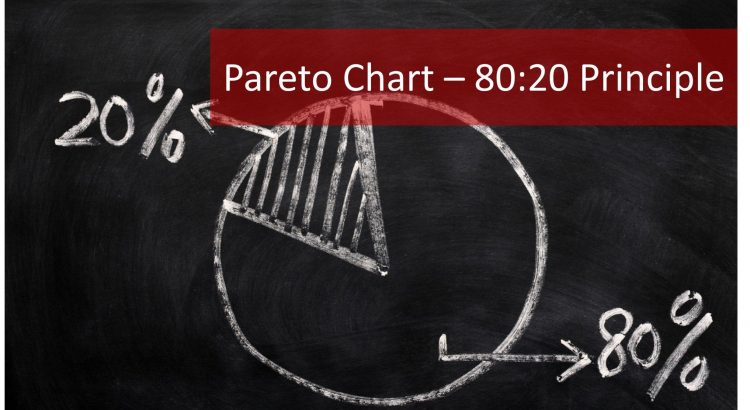
In the context of Six Sigma, the Pareto Chart is a member of the 7 QC Tools and is a valuable tool for the Measure phase of the DMAIC process. The Pareto Chart is named after Vilfredo Pareto, a 19th-century economist; who postulated that a large share of wealth is owned by a small percentage […]
