During the Six Sigma Measure Phase of the DMAIC cycle in the Six Sigma approach to problem-solving, we need to understand the degree of the process variation. The degree of process variation, as you will learn in Lean Six Sigma Green Belt training and also in some of the free Six Sigma courses, tells us how many defects a process will produce. For a process to be efficient, it must produce as little defects as possible and must, therefore, have as little process variation as possible. In the Measure Phase of the DMAIC process, we need to visualize process variation to see where we are at with process performance.
Attend our 100% Online & Self-Paced Free Six Sigma Training.
One way to see the process variation is the Measure Phase Control Chart. The Measure Phase Control Chart and other types of control charts are part of the 7 QC tools. The Measure Phase Control Chart is a graphical display of the outputs of a process over time. Not only that, it also shows how the process performs against control limits which are set to match the maximum and minimum variation in a process to deliver on customer demands.
What is Process Variation?
Before we move on to study the Measure Phase Control Chart, we first need to understand the concept of Process Variation in the context of the Measure Phase Control Chart. Every process has variation and there are 2 types of Process Variation:
- Common Cause Variation or CCV: CCV is due to the natural process variation. It is the variation due to the way the process was designed. CCV is simply the result of numerous, ever-present differences in the process. An example of CCV is the variation that might be seen by having several people working in the process. Each person might do things slightly differently. SCV is variation due to assignable or non-random causes.
- Special Cause Variation or SCV: SCV may be the result of causes which are not normally present in the process. An example of special cause variation is the variation that might result if someone untrained is allowed to work in the process Special cause variation is the process variation that can be assigned a reason.

Determine Special Cause Process Variation
The best tool to determine if the variation is Common Cause or Special Cause is the Measure Phase Control Chart. A Measure Phase Control Chart often is referred to as time series plot used to monitor a process over time. It is a plot of a process characteristic, usually through time, with statistically determined limits. When used for process monitoring, it helps the user to determine the appropriate type of action to take on the process.
The History of the Measure Phase Control Chart
Dr. Walter A. Shewhart introduced the concept of control charts in general in the 1920s. Because of his work, several control charts monitoring a single quality characteristic of interest are referred to as Shewhart Control Charts.
Control Limits in a Measure Phase Control Chart
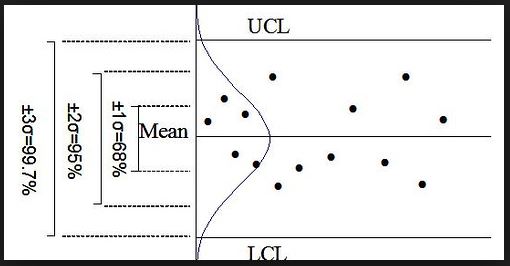
A Measure Phase Control Chart also refers to the frequency distribution plotted over time in the sequence that the data occurred and adds three reference lines for interpreting patterns in the data. These reference lines comprise a center line and two control limits. The center line of a Measure Phase Control Chart is the average or mean, and two control limits are known as Upper and Lower Control Limit. The control limits for a Measure Phase Control Chart are defined as three-sigma on either side of the collected data’s mean.
The question here is: Why three standard deviations? The reason is that it balances the likelihood of a false signal and maintains sensitivity to detect real signals. Special Cause Process Variation is identified by points falling below the lower control limit or above the upper control limit, trends, runs or any unusual patterns. Any indication of a special cause should be investigated to see if the process has changed.
Process Variation: Why Use a Measure Phase Control Chart?
The Measure Phase Control Chart is used during the Measure Phase of the Six Sigma DMAIC cycle. Depending on the number of process characteristics to be monitored, there are two basic types of Measure Phase Control Charts. The first, referred to as a Univariate Control Chart, is a graphical display of one quality characteristic. The second, referred to as a multivariate control chart, is a graphical display of a statistic that summarizes or represents more than one quality characteristic.
The Measure Phase Control Chart helps to:
- Determine whether a process is stable or not overtime. The process stability is measured in terms of a process operating within statistically determined control limits
- Measure, monitor, and control processes. Unusual process variation is signaled by any point outside or specific patterns within the control limits on the Measure Phase Control Chart
- Determine what special cause event is that needs to be identified and eliminated
- Mitigate Common Cause Variation (Predictable and Expected) or the inherent process variation versus unexpected process variation
- Predict changes and indicate the need to improve process performance or determine if an improvement actually reduces process variation. The key triggers include Quality, Cost, and Capacity
Process Variation: Measure Phase Control Chart Terminologies
To understand the subject of the Measure Phase Control Chart, it is necessary to understand the relevant basic terminologies. These terminologies discuss the basic features of the Measure Phase Control Chart.
- Statistical Process Control. A Statistical Process Control (SPC) is the application of statistical methods to identify and control special cause process variation. SPC is applied in order to monitor and control a process.
- Upper Control Limit. It is a value that indicates the highest level of quality acceptable for a product or service. The Upper Control Limit is used in conjunction with the Lower Control Limit to create the range of variability for quality specifications.
- Lower Control Limit. It is a value that indicates the lowest level of quality acceptable for a product or service. It refers to the bottom limit in quality control for data points below the average line in a control chart; normally opposite of Upper Control Limit.
- Special Cause Variation. That is due to assignable or non-random causes. This kind is normally not present. In other words, this is the result of unpredictable errors.
- Common Cause Variation. This arises due to the natural variation of the process. It is due to the way the process was designed.
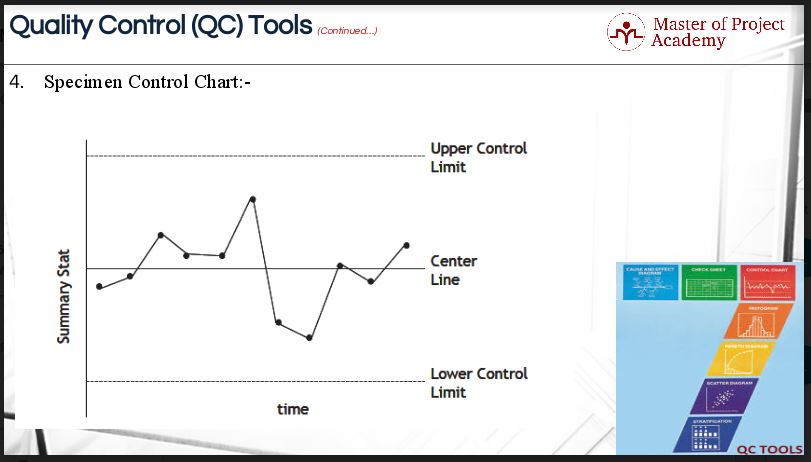
Have a look at this example of a Mesure Phase Control Chart in the figure below. It is a Measure Phase Control Chart with all points in control. The Y axis is the metric of interest, and the X axis is time or a factor that indicates time such as a lot or run number.
Types of Measure Phase Control Charts
There are many types of Measure Phase Control Charts, but generically these lines can be described as follows:
- Center line is the Mean of the metric of interest on the Measure Phase Control Chart
- Lower Control Limit towards the top of the Measure Phase Control Chart that is equivalent to Mean of the metric minus 3 multiplied by Standard Deviation of the metric
- Upper Control Limit towards the bottom of the Measure Phase Control Chart that is equivalent to Mean of the metric plus 3 multiplied by Standard Deviation of the metric
The Measure Phase Control Chart is a great way to visualize the process variation during the initial stages of the Six Sigma project. With a Measure Phase Control Chart, you can see the natural process variation and whether it is within the upper and lower specification limits which are set according to the Voice of Customer. The Measure Phase Control Chart shows whether the process is out of balance due to natural variation or if there is a problem causing this special variation. This knowledge gained from the Measure Phase Control Chart helps Six Sigma teams to get an idea of the scope of the problem. And that is why the Measure Phase Control Chart is such a useful tool to Six Sigma teams during the Measure Phase of the DMAIC process.