
PMP certification training states that time management knowledge area deals with the relation of the activities, their starting and ending times, project schedule in general and assures the timely fulfillment of each project activity. So while applying time management, the project activities should be determined, their interrelationship should be defined, network diagram should be created and the schedule network analysis should be done.
Attend our 100% Online & Self-Paced One-Hour Free PMP Training.
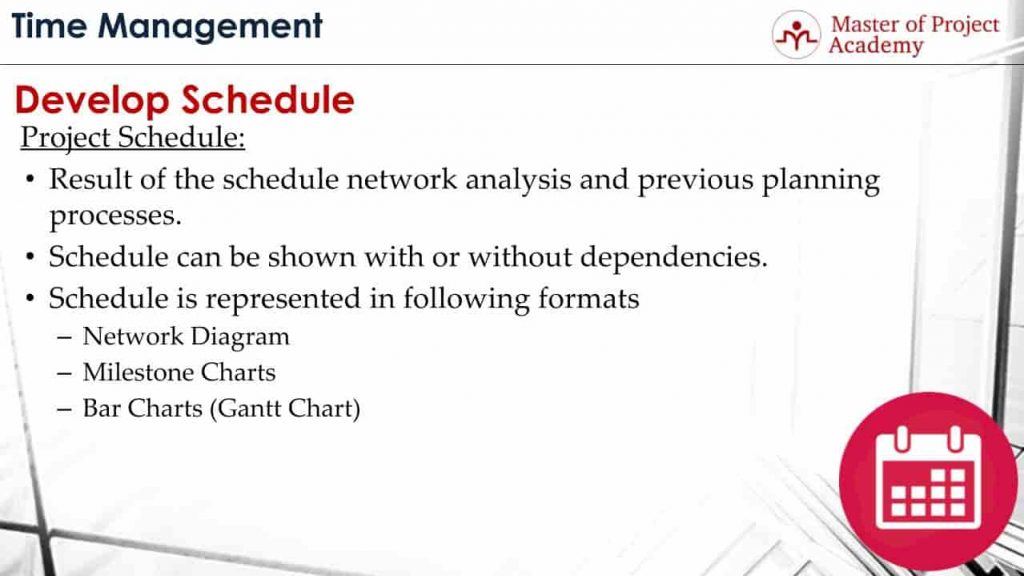
In Develop Schedule process, which is the 6th process of this knowledge area, the information accumulated throughout past processes are gathered and the overall project schedule is completed. This includes the start and end dates of each individual activity in a project. So we can state that, as also told in the online PMP course, the Project schedule is the end result of the schedule network analysis and all those previous planning processes.
In this article, we are going to have a detailed look at the project scheduling techniques, project scheduling process, and project schedule examples.
What is the Objective?
Project schedule shows which project activity will start and finish when, who will perform which activity, which activity depends on which activity etc. Overall project duration can be determined after finalization of the project schedule.
Project schedule can be shown with or without dependencies. For example, let’s say that a testing of a project activity depends on the completion of development of the regarding activity first. But, the project schedule may or may not show this dependency. However, these kinds of relationships in the network diagram will affect and determine the start and end dates of each activity and project schedule must show these dates respectively.

3 Common Formats
The project schedule is represented in 3 common formats in a project.
Project Schedule Format #1: Network Diagram
Network Diagrams visualize the project activities in boxes with the activity IDs and show the interrelationship of activities with arrows. Network diagrams indicate if an activity will start earlier, later or at the same time with a different activity.

Project Schedule Format #2: Milestone charts
Milestone charts show the critical dates of a project on a timeline. Milestones have zero duration and only represent a specific and important moment in the project. Generally, milestones do not have an assignee as well.
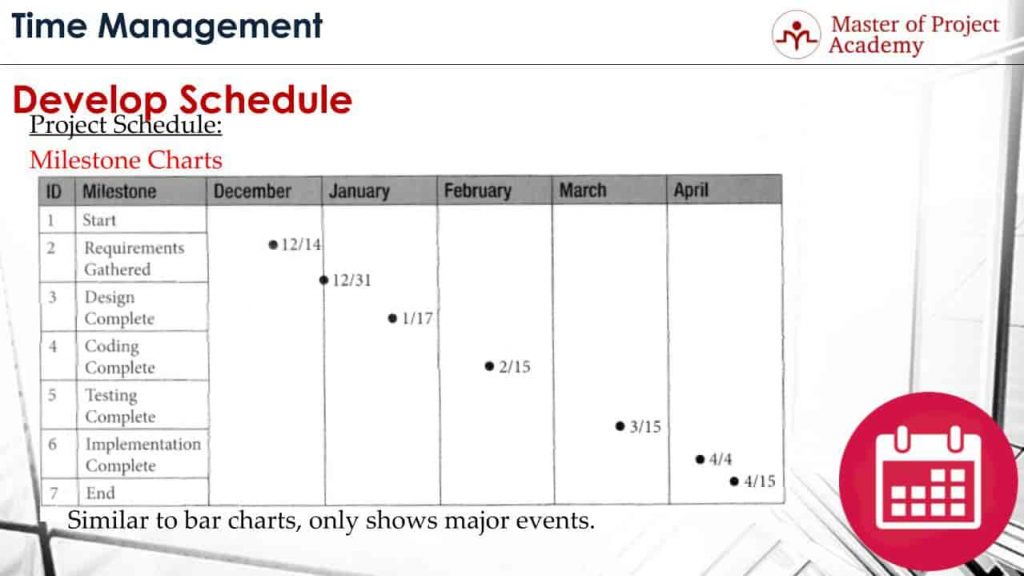
As you see in this example, there are 7 milestones for this software project. The start of the project, completion of requirements gathering, completion of design, completion of coding, completion of testing, completion of implementation and completion of the project. In a software project, there will be several project activities to complete, but as you see, milestone chart only shows 7 major steps of the project and dates for these milestones as well.
Project Schedule Format #3: Bar charts or Gantt charts
Milestone charts are similar to bar charts or Gantt charts, the only difference is, milestone charts show only significant events of a project. Bar charts or Gantt charts show activity ID, activity name, duration, start and end dates of project activities in a list. In this example, there are 10 project activities as you see and their duration, start and end dates are listed in the chart respectively.
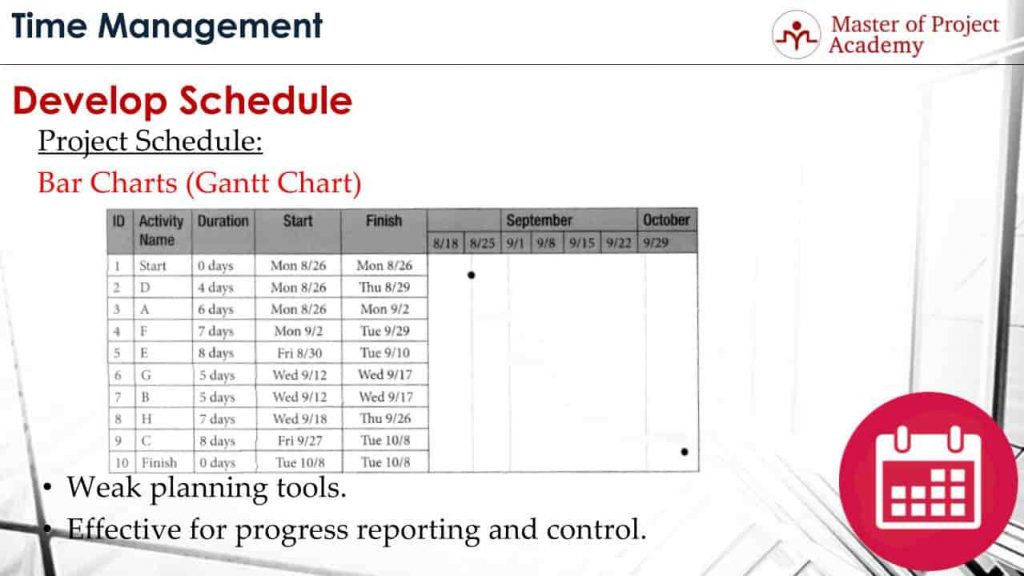
Gantt charts are weak planning tools. Because they are activity specific and do not show the relationship of activities or critical path of a project as network diagrams do.
Gantt charts are effective for progress reporting and control. For instance, in order to show which activities are completed, which activities are in progress and which activities are remaining to be completed can be listed with Gantt charts. The project team can see start and end dates of each activity from Gantt charts as well.
What are the advantages of different project schedule formats?
We have seen 3 types of project schedule reports. But which format is useful when?
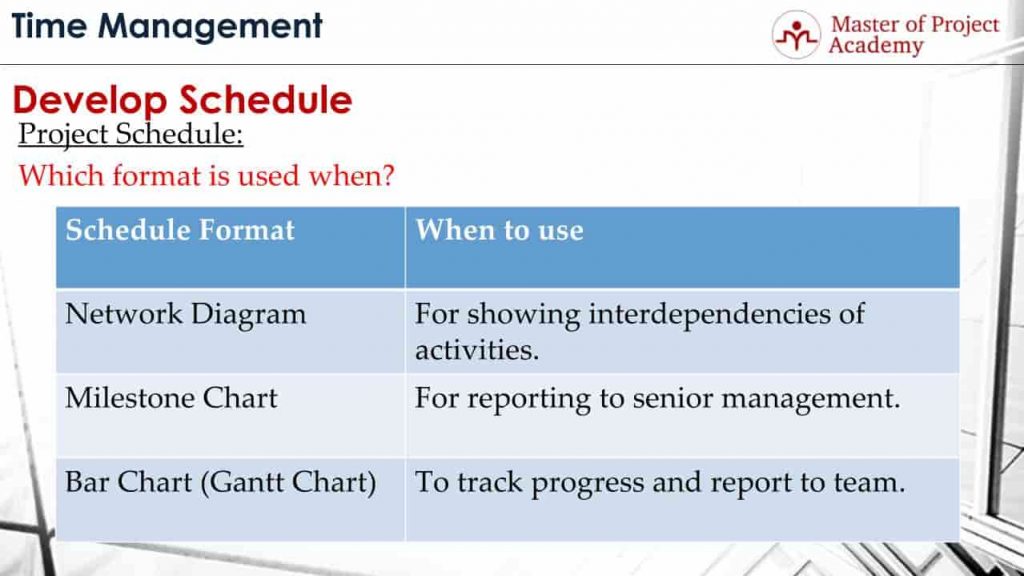
- Network diagrams show the critical path of a project and the interdependency of activities with each other. Therefore, if you would like to stress these, network diagram will be a good option.
- Milestone charts show only critical moments of a project. Therefore, if you are preparing a report for senior management, high-level information will be more relevant for them instead of activity by activity detail.
- Gantt charts are used to track progress and report to the team. For instance, if you would like to show completed activities, activities in progress or activities of the coming weeks etc., Gantt charts will be a better option for this type of reporting.
Briefly, you need to use the appropriate format of reporting depending on which stakeholders you will be reporting and what you will be reporting.

One thought on “The 3 Most Common Formats For Creating the Project Schedule”
Comments are closed.