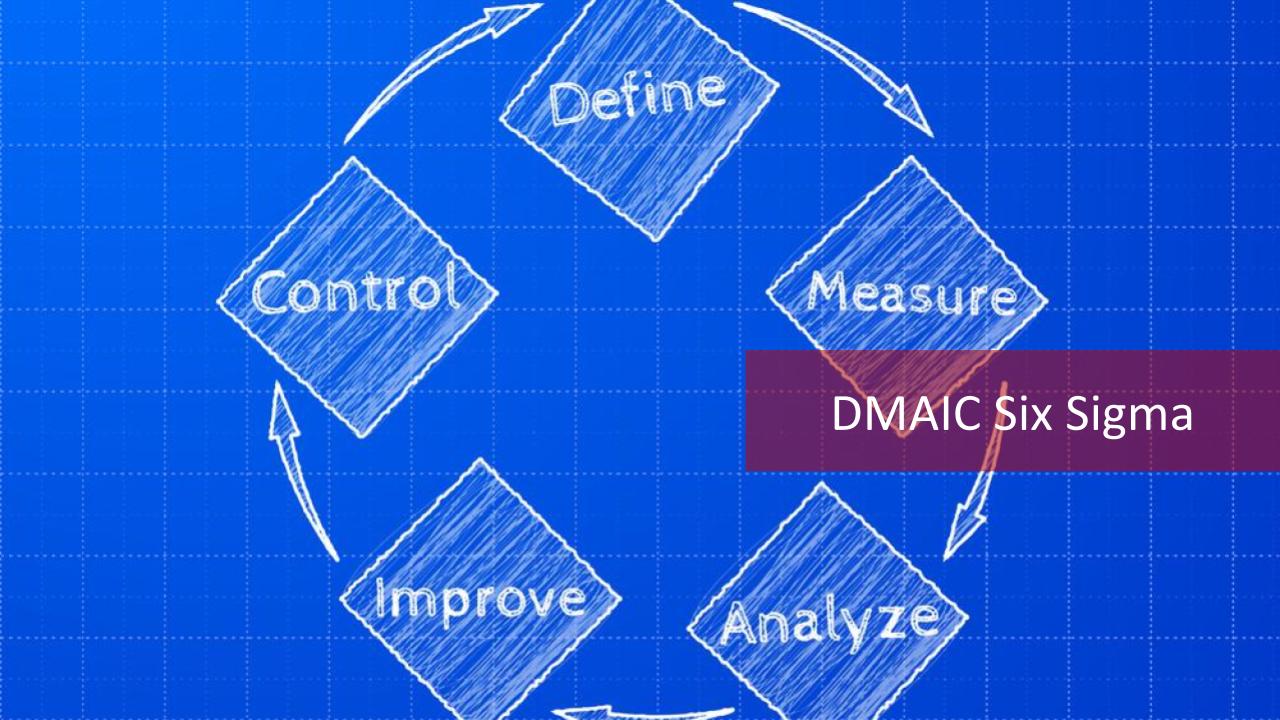
Six Sigma is a problem-solving process that is used by engineers and other professionals worldwide. The Six Sigma process is a structured, data-driven approach to problem-solving. There are many aspects to the 6 Sigma ranging in difficulty which is why there are levels of Six Sigma Certification: green belts, black belts, and master black belts. […]
Tag: DMAIC
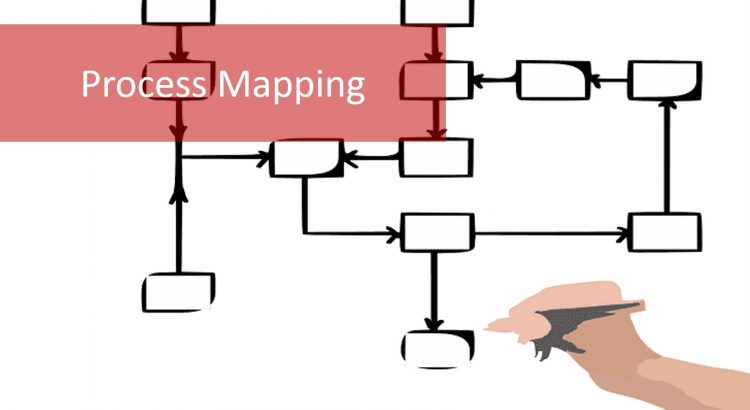
Process Mapping Techniques and Important Tips
There are many Six Sigma tools that are covered in Lean Six Sigma Green Belt training. One of the most important processes of the Six Sigma Define phase of the DMAIC cycle is Process Mapping. Process mapping is one of the fundamental Six Sigma principles that are shortly covered in free Six Sigma courses. But […]
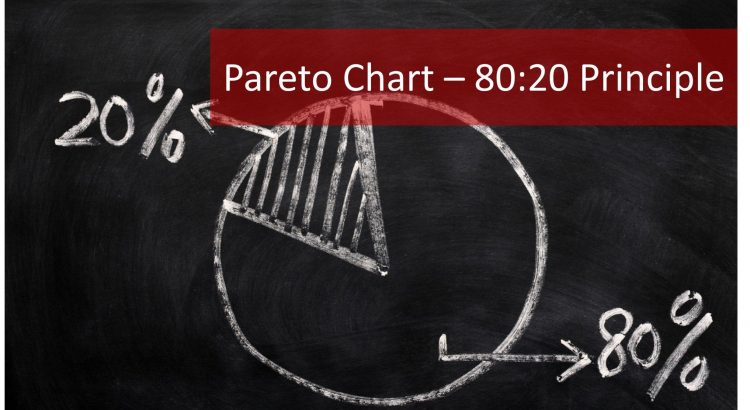
10 Steps for Creating a Pareto Chart
In the context of Six Sigma, the Pareto Chart is a member of the 7 QC Tools and is a valuable tool for the Measure phase of the DMAIC process. The Pareto Chart is named after Vilfredo Pareto, a 19th-century economist; who postulated that a large share of wealth is owned by a small percentage […]
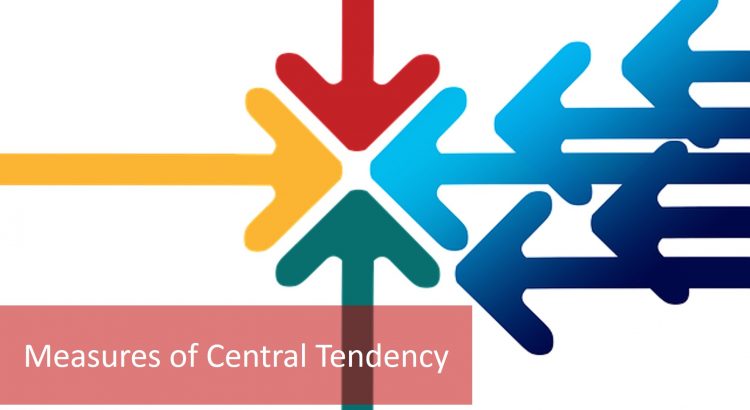
Measures of Central Tendency: Mean, Median & Mode
Statistics. While others might stifle a yawn at the mere word, Six Sigma practitioners who have passed the Lean Six Sigma Green Belt course knows that without statistics, no Six Sigma project will succeed. Statistics is simply part of the data-driven Six Sigma approach. At the Six Sigma Green Belt level, we need to have […]
9 Steps For Constructing The Fishbone Diagram
The Cause-and-Effect Diagram is one of the Six Sigma 7 QC Tools. It goes by several names, the most popular being a Fishbone Diagram because a completed diagram resembles the skeleton of a fish. It is also sometimes referred to as an Ishikawa Diagram after its creator. Leading online six sigma courses and Lean Six […]