
Statistics. While others might stifle a yawn at the mere word, Six Sigma practitioners who have passed the Lean Six Sigma Green Belt course knows that without statistics, no Six Sigma project will succeed. Statistics is simply part of the data-driven Six Sigma approach. At the Six Sigma Green Belt level, we need to have the basic understanding of many statistical methods. Six Sigma Black Belts and Green Belts typically use a statistical program such as MINITAB to perform calculations. However, it is always good to understand the underlying principles of a measure, such as the measures of central tendency.
- Unlocking Success: 10 High-Powered Careers Transformed by Six Sigma Mastery
Attend our 100% Online & Self-Paced Free Six Sigma Training.
Statistical tools are used in the Measure and Analyze phases of the DMAIC process, as you will learn from a reputable free Lean Six Sigma courses. The most basic statistics that a Six Sigma practitioner will look at are measures of central tendency. Measures of central tendency is one of the first things that Six Sigma teams look at after collecting data.
Two branches of statistics
Let us first have a look at two branches of statistics. The first branch is known as Descriptive Statistics and the second branch is known as Inferential Statistics. Descriptive statistics are used to describe a population, process, sample and their characteristics, such as location (measures of central tendency), spread (variation), and shape (skewness and peaks). So, the measures of central tendency is a type of Descriptive Statistics. Inferential statistics make inferences and predictions about a population data based on a sample of data taken from the population in question. These are typically used in the Analyze phase of the DMAIC process.
Measures of central tendency
What are measures of central tendency? Measures of central tendency represent a single value that attempts to describe a set of data by identifying the central position within that set of data. As such, measures of central tendency are sometimes called measures of central location. In other words, it is a measure that tells us where the middle of a set of data is. The mean, which is often called the average, is the most well-known of the measures of central tendency. However, there are other measures of central tendency, such as the median and the mode. The mean, median and mode are all valid measures of central tendency.
Measures of Central Tendency: Mean
The mean, which is also known as the average, is the most popular and well known of the measures of central tendency. It can be used with both discrete and continuous data, although it is used more often with continuous data. The mean is equal to the sum of all the values in the data set divided by the number of values in the data set. Therefore, the formula for the mean would be read: sum of the observations divided by number of observations
Measures of Central Tendency: How to Calculate the Mean?
In this article, we’ll look at some examples to describe each of the measures of central tendency. Let’s look at some examples of the mean in the figure below. The numbers ranging from 1 to 8 have been summed and the sum has been divided by the number of observations, which is 8. Hence, the answer is 4.5. The average or mean is 4.5.
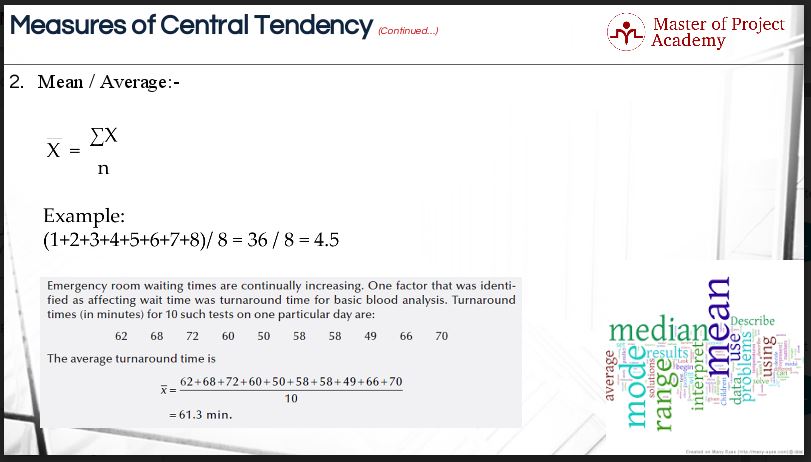
In the second example, the waiting time in the hospital has been impacting turnaround time for basic blood analysis. The data for turnaround time was collected for 10 such tests on a given day to calculate the average turnaround time. The unit of measurement for data collection was minutes. To calculate the mean, we summed the turnaround time for ten blood analysis tests and then; the sum was divided by the number of observations to arrive at the average turnaround time for basic blood analysis. The answer here is 61.3 minutes. This is an example of the most well known of the measures of central tendency.
Measures of Central Tendency: Median
Of the measures of central tendency, it is the median that is also known as the positional average. Positional averages are based on the position of the given observation in a series, arranged in an ascending or descending order. The median is that value which divides the group into two equal parts, one part comprising all values greater, and the other, all values less than median. In other words, the median of a sequence of numbers is the value that lies in the middle of the sequence when sorted from smallest to largest or vice versa. The median is an example of one of the measures of central tendency.
Measures of Central Tendency: How to Calculate the Median?
The formula for calculating the median is read as: ‘n’ plus 1 divided by 2. The median will be the value lying at the position; which has been suggested by the solution to the formula. Have a look at the two examples below. The numbers ranging from 1 to 8 have been counted according to the formula. The answer is 4.5. The median is not 4.5. The value that lies at the 4.5th position is the median value. The question is: how will you calculate the value which lies at the 4.5th position? The formula to do this would be 4th value plus half of the 5th value minus 4th value.
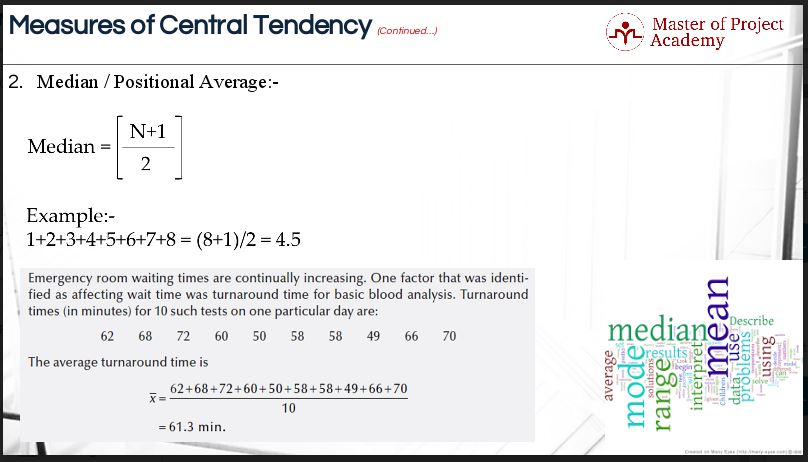
For the second example, let’s use the same example that we used for calculating the average. The data for turnaround time was organized in ascending order. To calculate the median, we will have to count the number of data points and compose the formula. The answer here is 5.5. The value that lies at the 5.5th position is the median value. Hence, the median is 61 minutes.
Mode
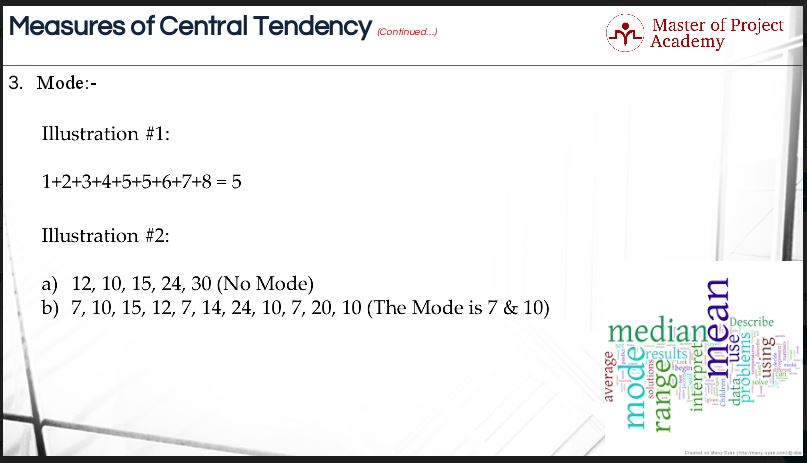
The mode refers to that value in a distribution which occurs most frequently. It is an actual value, which has the highest concentration of items in and around it. Please have a look at two examples in the figure below. In the first illustration, the most frequently occurring value is 5. That is why the mode will be 5. In the second illustration, the values of 7 and 10 occurred 3 times in a data set. Therefore, the mode will be 7 and 10.
In statistics, nothing works without a formula. Therefore, you need to have a formula for everything you do in Statistics. Of course, all measures of central tendency can easily be calculated in software solutions such as MS Excel, but it’s good to know how to calculate these measures of central tendency by hand.