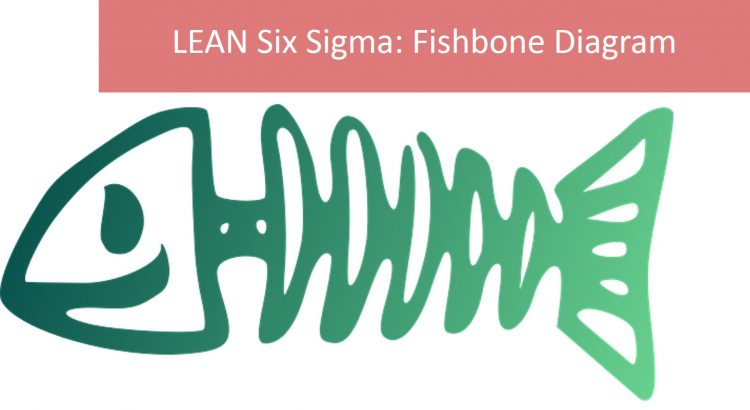
The Cause-and-Effect Diagram is one of the Six Sigma 7 QC Tools. It goes by several names, the most popular being a Fishbone Diagram because a completed diagram resembles the skeleton of a fish. It is also sometimes referred to as an Ishikawa Diagram after its creator. Leading online six sigma courses and Lean Six […]
Tag: six sigma measure

Data Collection Plan: Learn to Create It In 8 Steps
In the DMAIC framework of the Six Sigma Method, a Data Collection Plan is created during the Measure phase. A project manager who already has a Six Sigma Green Belt training will know that it is a useful tool to focus your efforts on. It is a detailed document that describes the exact steps as […]

2 Types of Data for Six Sigma Measure Phase
The Six Sigma approach is a data-driven approach to problem-solving. It stands to reason that the people who study in a Lean Six Sigma Green Belt course will be confronted with different data types in Six Sigma measure phase. Even some reputable free Six Sigma Green Belt Certification training will cover different types of data when discussing the […]

Why Operational Definition is Important in Six Sigma Measure Phase?
Six Sigma Green Belt practitioners who took a Lean Six Sigma Green Belt training have a firm grasp on the concept of “Operational Definition” in the measure phase and how it can help a project using the Six Sigma approach. Let’s define an “Operational Definition.” It can be defined as a clear and understandable description of […]
