
In Project Time Management‘s 5th process, which is the Estimate Activity Durations process, the duration of the activities is estimated based on a certain estimation technique. According to project management professional certification training, the estimation technique should be chosen regarding the project’s complexity and also its other aspects. In other words, one estimation technique may be suitable for a certain project, but it might not suitable for another one.
Attend our 100% Online & Self-Paced One-Hour Free PMP Training.

If you already tried to solve some sample pmp exam questions, in your PMP Study Plan, you must be aware of that choosing an estimation technique is an important decision in PMP Time Management. Do you know what is the most common estimation technique? Do you know which estimation technique is better if you have similar activities from previous projects? Why don’t we go over 5 alternatives for choosing an estimation technique and give examples for each estimation technique?

Choosing the Right Estimation Technique for Your Project
Let’s go over each estimation technique one-by-one!
One-Point Technique
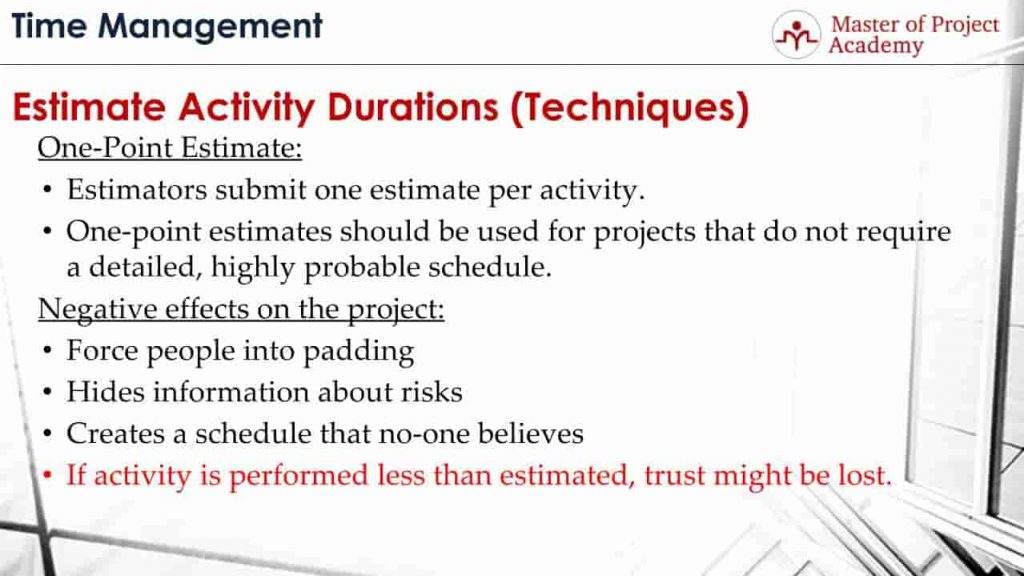
The first estimation technique is One-Point Estimate. In one-point estimate technique estimators submit one estimate per activity. Estimator goes through the activity description and details. Based on the information available, they provide an estimation to complete this activity. For instance, “4 days needed to complete installation”.
One-point estimates should be used for projects that do not require a detailed, highly probable schedule. This means, if a precise and accurate schedule is not a must in your project, you can use this estimation technique.
If you need a more detailed schedule in your project, one-point estimation technique can have negative effects on the project. These are:
- One-point estimate technique forces people into padding. Since there is limited information about an activity and you ask a fixed estimate for the project duration, estimator feels to say something although he might not be confident to provide an estimate yet. Thus, he tends to do padding in order to accommodate ambiguities during estimations.
- Hides information about risks. Because, during estimation, assignee of the task provides an estimate based on available information. However, in other techniques, for instance in PERT technique, 3 estimates are taken for an activity: optimistic, most likely and pessimistic. And if there are lots of difference between optimistic, most likely and pessimistic values, this gives an indication of the risk level of the activity.
- Creates a schedule that no-one believes. This is because of the nature of the one-point estimate actually. Since every assignee gives an estimate for the activities without detailed analysis or backing, this causes unrealistic schedules to occur respectively.
- If the activity is performed less than estimated, trust might be lost. Let’s say you have used one-point estimation technique in your project during Estimate Activity Durations process. And one developer said, his estimate for a screen development is ten days, but after the actual results, you have seen that the developer completed his work in six days. And for another developer, you discover that his estimation was 20 days, and he completed his task in 13 days. These kinds of early finish of project activities will make your customer think about the precision of your estimates, because you have given a high estimate in the beginning, but your actual results show that the activities can be completed in shorter durations.
So this estimation technique is not suitable for projects with precise and accurate schedules.
Analogous Technique
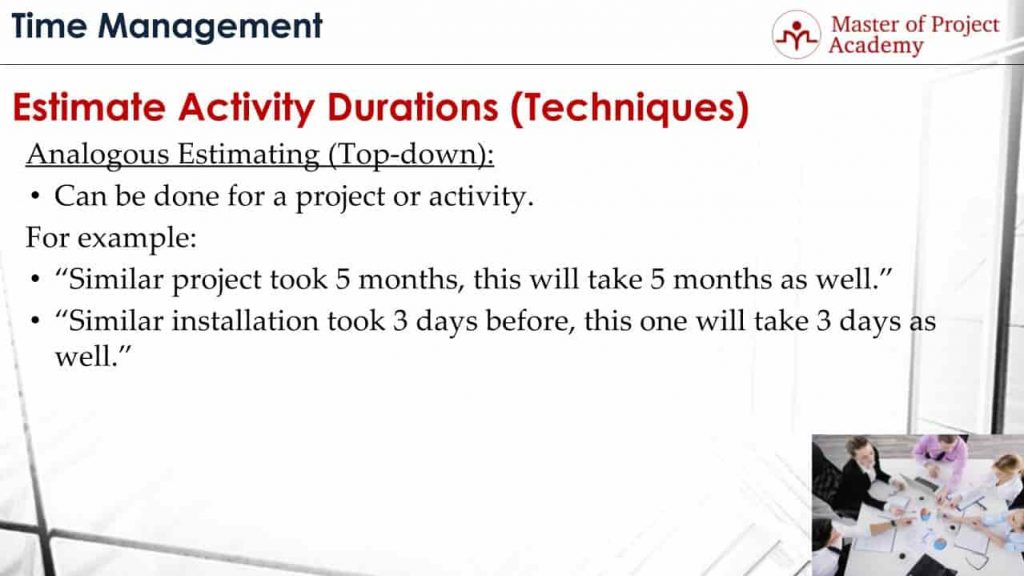
The second estimation technique is Analogous estimating. This estimation technique is known as top-down estimating as well. In analogous estimation technique, if there are similar activities from previous projects that have been completed, new activities are estimated based on the actual values and experience earned from the previous project.
Analogous estimation technique can be applied to a project or activity. So the total project can be estimated if the whole project is similar to a project that has been completed before. Or, this estimation technique can be done on activity level.
Let’s see some examples for analogous estimation technique:
- A similar project took 5 months, this will take 5 months as well. In this case, if the company is initiating a new project that is similar to a project that has been completed, duration of the new project is estimated based on the previous project duration.
- Similar installation took 3 days before, this one will take 3 days as well. In this case, an installation activity will take place in a new project which is very similar to the previous project’s installation activity. And therefore, the same duration is estimated.
Estimation Technique #3: Parametric Estimation Technique
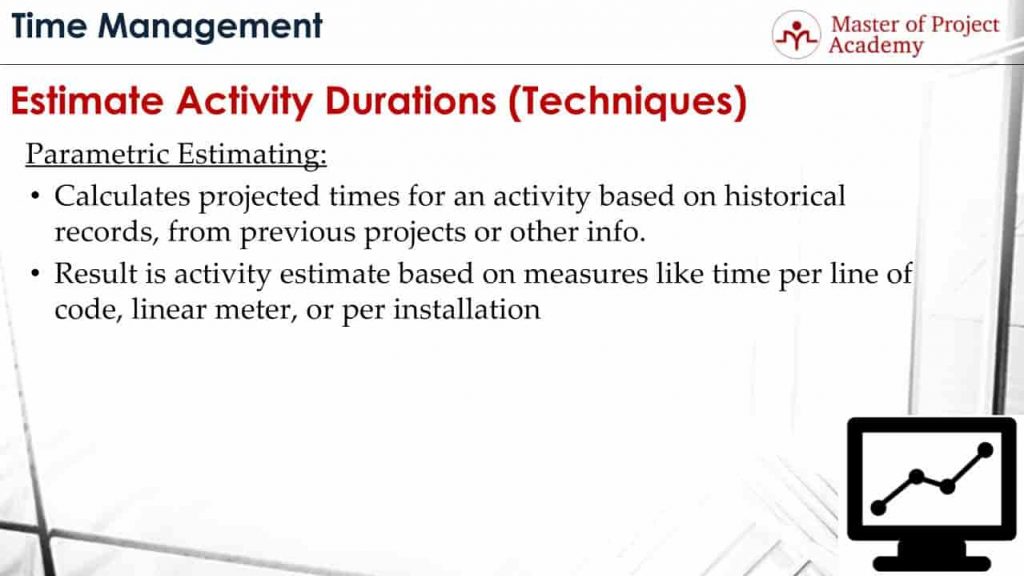
Parametric estimation technique calculates projected times for an activity based on historical records, from previous projects or other info. This estimation technique is actually a mathematical approach to find the estimation of a project activity. Parameters that might affect the duration of a project activity are determined and based on these parameters, project activity durations are estimated.
The result of the parametric estimation technique is the estimates based on measures like time to spend per line of code, linear meter or per installation.
For instance, let’s consider that you are managing a software project, in order to estimate the duration of project activities, time spent for writing a line of code is important. Based on this parameter, you can guess the duration of the other activities. Or, if you are managing a construction project, and if you know how long it takes to complete 1-foot square area to build, you can estimate the project activities duration with this parameter.
Parametric estimating has two approaches mainly:
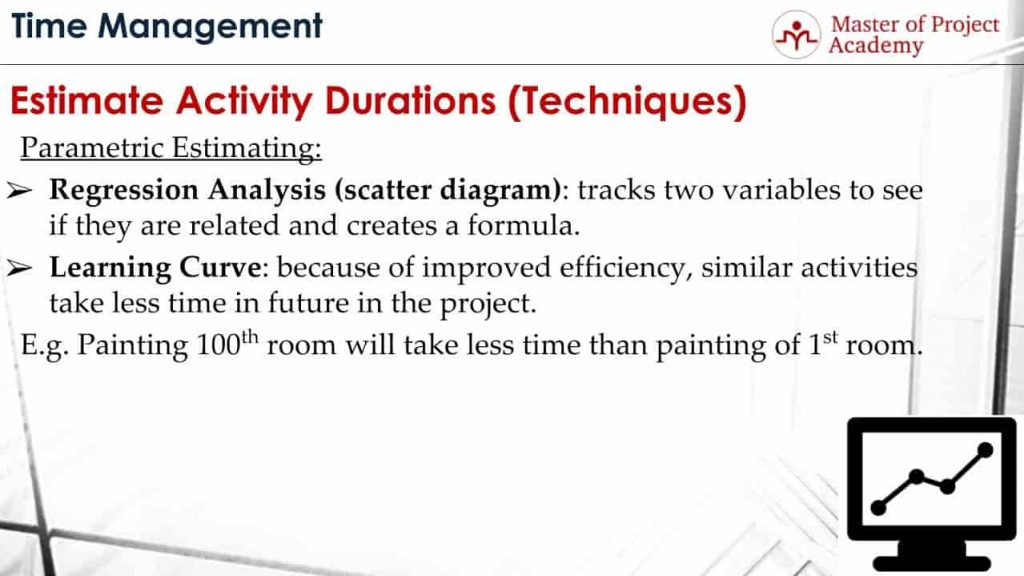
- The first approach is Regression analysis or a scatter diagram. In this approach, two variables are analyzed to see if they are related to each other. For instance, the number of functions in a screen and number of boxed in a screen. These might give us about the complexity of a screen in a software project.
Another example can be the experience of the software developer and time to complete a screen. It is expected that time spent on the development of a screen should decrease as the experience of the software developer increases. Regression analysis is done to check whether these variables are related to each other.
- The second approach is Learning Curve. This approach proposes that because of improved efficiency and experience, similar activities in a project should take less time in future in the project.
For instance, if you are managing a construction project and there will be 100 rooms that need to be painted, it is expected that painting 100th room will take less time than painting the 1st room. Because the workers will have more experience on the building and painting similar room. Or similarly, a software developer is expected to develop a similar screen in a shorter time in a software project.
Heuristics Technique
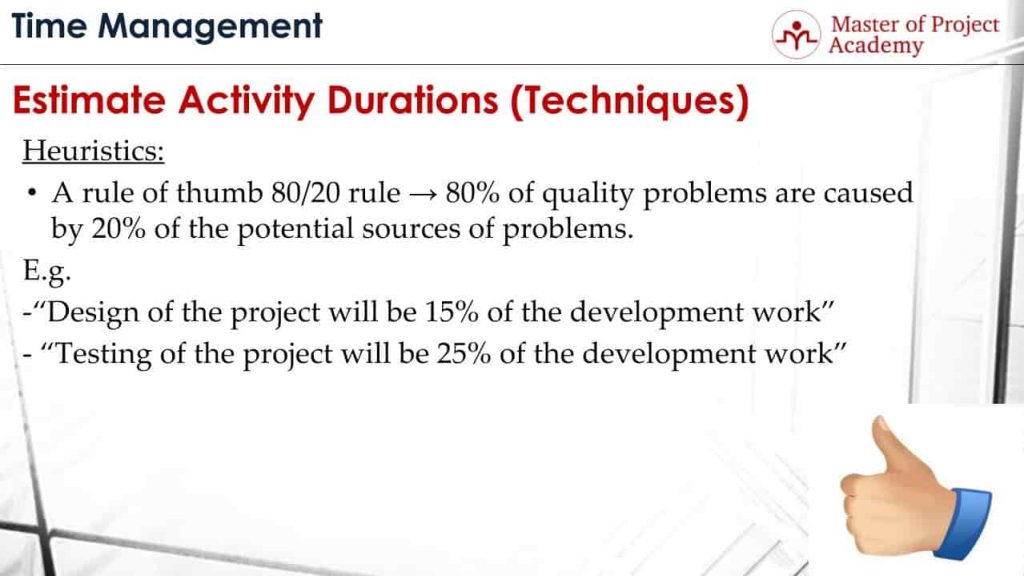
Heuristics is another estimation technique for Estimate Activity Durations process. In Heuristics estimation technique, activity duration of an activity is estimated over an assumed rate, which generally comes from industry practices.
For instance, Rule of thumb 80/20 states that 80% of the problems are caused by the 20% of the potential source of problems. By this way, you focus on that 20 % to fix the majority of the problems in an environment.
Let’s give some other examples of Heuristics estimation technique:
In a Software project, industry practices say that the design of the project will be 15% of the development work. This is not a rule of God for sure. There might be exceptional and extraordinary software projects that go beyond this ratio. For instance, if you are running a major infrastructure project in an IT company, it is expected that design work will be higher compared to a regular software project.
Similarly, the testing of a software project is estimated as 25% of the development work. And of course, this can vary depending on the software project dynamics. For instance, if you are testing a website on several smartphones and web browsers to check its responsiveness, this will take a long time in the project respectively.
Three-Point Estimation Technique (PERT Analysis)
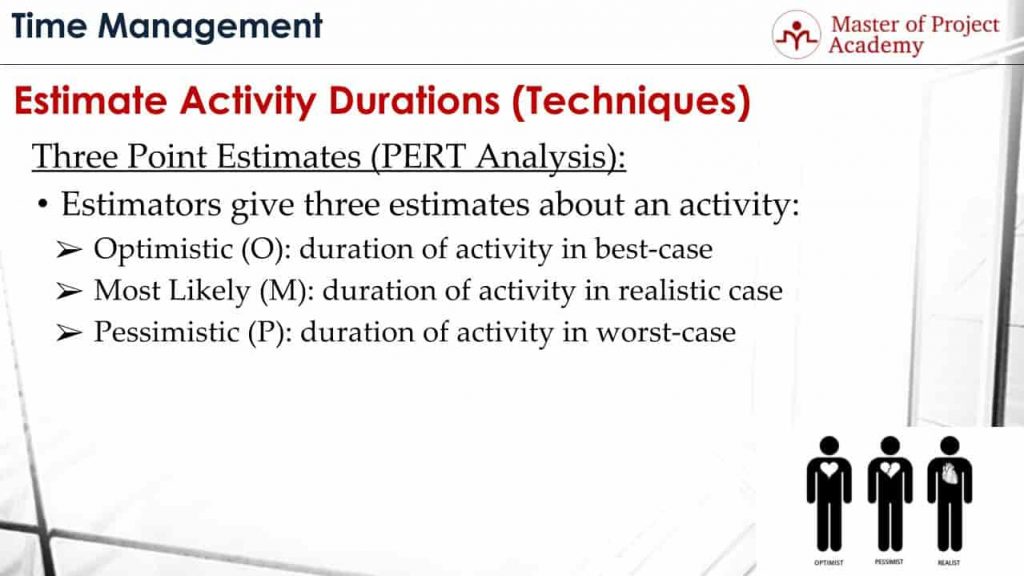
The last estimation technique is Three-point estimates or PERT Analysis. This estimation technique is the most common estimation technique to calculate activity durations in a project. In PERT Analysis estimation technique, Estimators of the project activities provide three estimates for each activity.
- The first one is Optimistic activity duration. This estimation is provided for the best case scenario. Estimator considers that everything will go smoothly during the activity and provides an estimation for this case.
- The second one is Most Likely activity duration. This estimation is provided for the realistic scenario. We all know that there will be issues, problems in the project. Estimator considers probable issues he could face during the activity and provides an estimation for this case.
- The third one is Pessimistic activity duration. This estimation is provided for the worst case scenario. Estimator considers all possible issues that could happen during the activity and provides an estimate that the activity could be finished in the worst case.
The 2 approaches to the PERT estimation technique
After optimistic, most likely and pessimistic estimations for an activity are collected, there are 2 approaches in calculating PERT estimation technique.
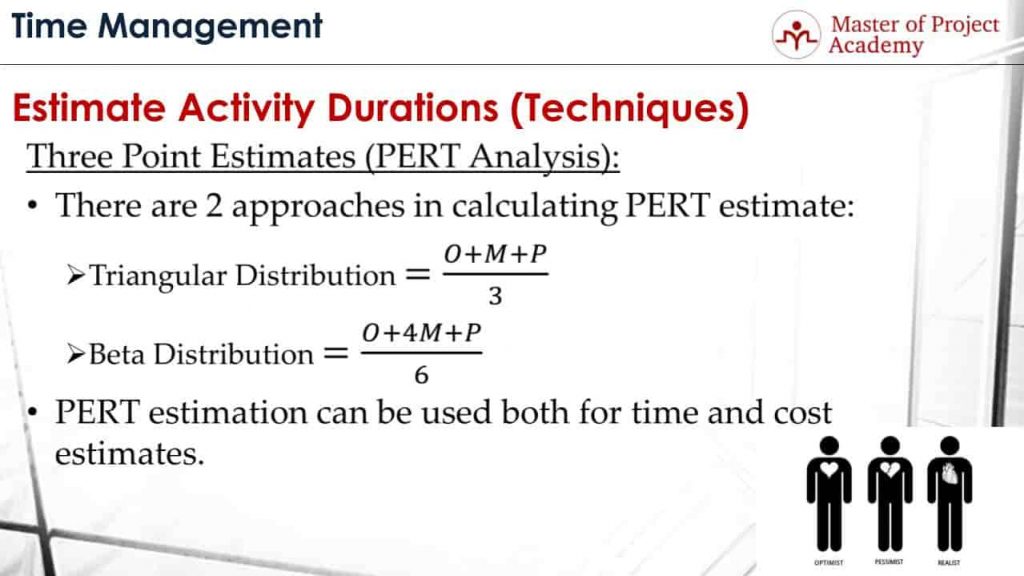
- The first approach is Triangular Distribution. In triangular distribution, average of the optimistic, most likely and pessimistic estimations are taken and this represents the activity duration.
- The second approach is Beta distribution. In beta distribution, optimistic and pessimistic estimates are summed up with the 4 times multiplied value of most likely estimate. Then, the result is divided into 6 and this represents the activity duration.
The triangular distribution gives equal weight to each estimation while beta distribution gives higher weight to the most likely estimate by multiplying it with 4. Therefore, activity duration in beta distribution comes close to the most likely estimate.
Note that PERT estimation technique can be used for time and cost estimates. So although we have seen this as an estimation technique in the estimate activity durations process, it can be used when determining the required budget for an activity as well.
What are activity standard deviation and activity variance?
It is better to provide activity standard deviation and activity variance definitions as well.
- Activity standard deviation is calculated by dividing the difference of pessimistic and optimistic estimates to 6.
- Activity variance is calculated by taking the square of activity standard deviation.
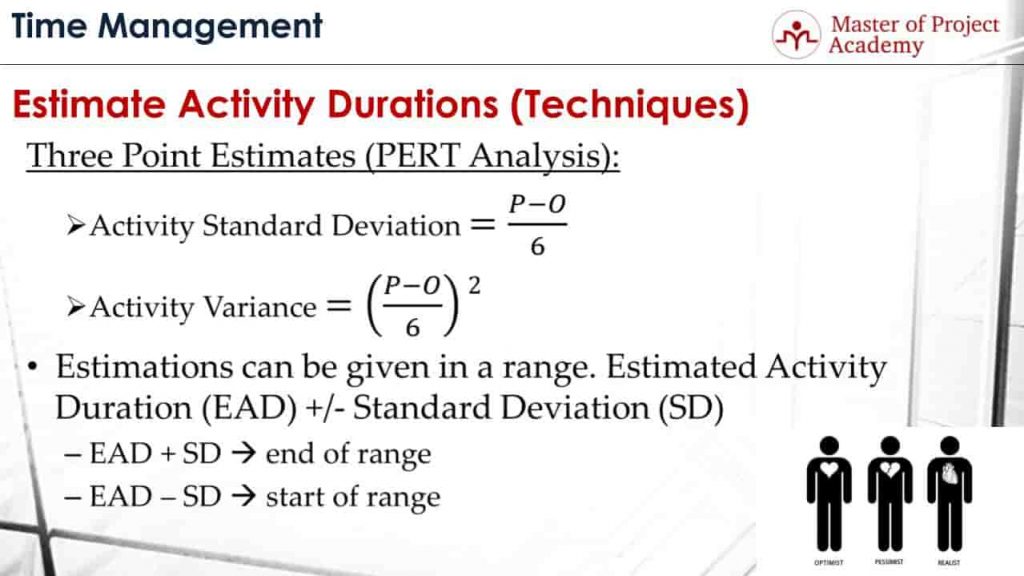
Since an estimation is provided for an activity during Estimate Activity Durations process, estimations can be given in a range instead of one exact estimation. And this range is given with the help of estimated activity duration and standard deviation.
Estimated Activity Duration Plus Standard Deviation gives the end of the range and Estimated Activity Duration minus Standard Deviation gives the start of the range.
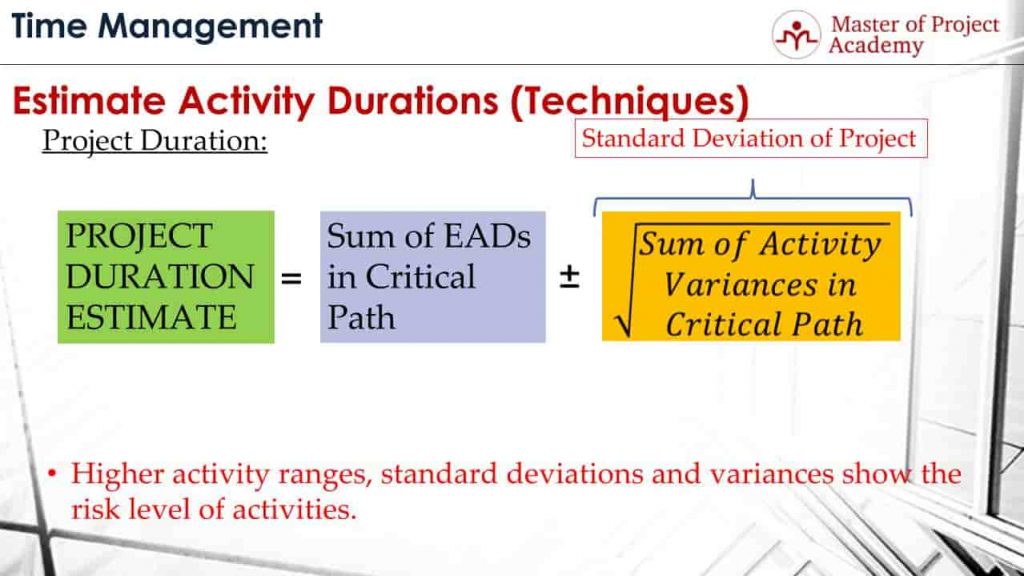
After the activity duration estimates are completed, project duration is estimated by the sum of estimated activity durations in the critical path of the project.
The standard deviation of the project will give a range for the project duration as well. The standard deviation of a project is calculated by taking the square root of the sum of activity variances in the critical path of the project.
For a well-defined and clear activity with no or very little risk, we expect to see pessimistic and optimistic estimates will be closer. Because, the activity is clear, there are no ambiguities and the estimator expects no high surprises during performing the activity.
Therefore, the higher activity ranges, standard deviations, and variances show the risk level of activities. If there are unclear points, so many ambiguities or risks with an activity, the estimator will consider all these when providing an estimate for the pessimistic value, and this will cause a higher standard deviation, variance, and activity range respectively.
Three-Point Estimation Technique Example
Let’s go through a PERT Analysis or in other words, Three-Point Estimation Technique example.
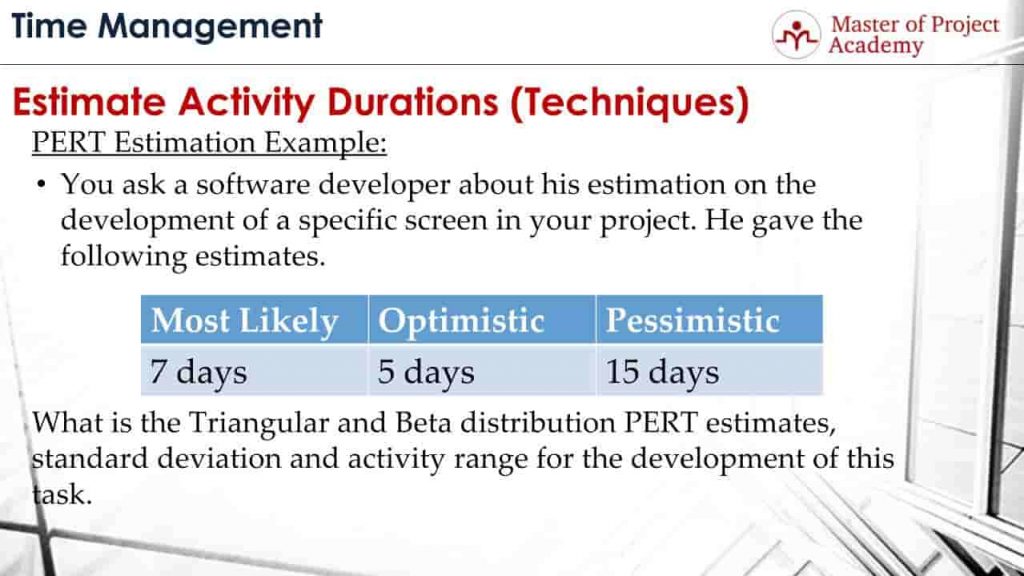
Let’s assume that you are the project manager of a software project. You ask a software developer in your team about his estimation on the development of a specific screen. He gave the PERT estimates as follows: “Most Likely, 7 days, Optimistic 5 days, and pessimistic 15 days”. After you get these estimates for an activity, estimated activity duration is calculated in next step.
So what is triangular and Beta distribution PERT estimates, standard deviation and activity range for the development of this screen? We will see in detail now.
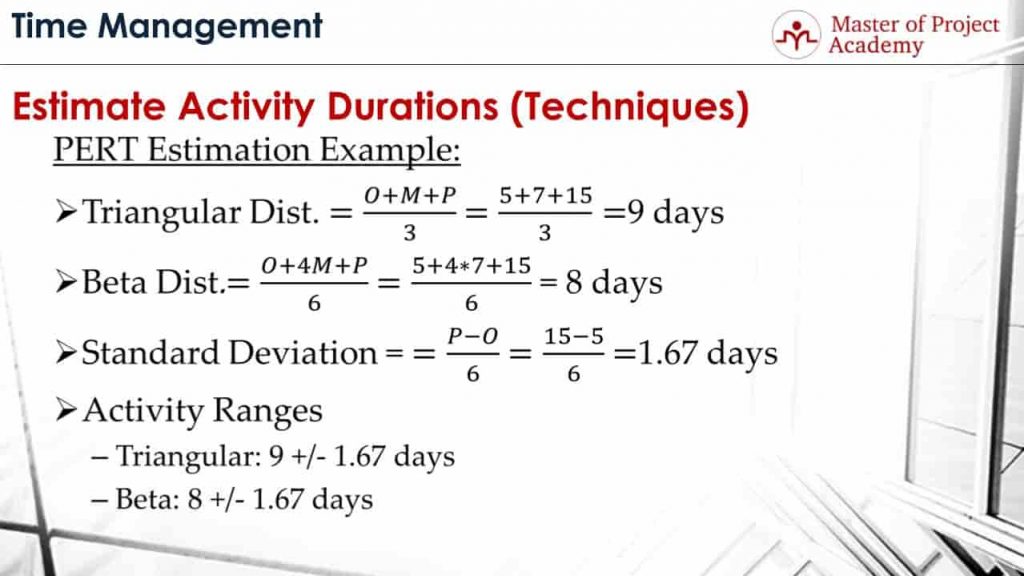
The triangular distribution was calculated by taking the average of three estimates optimistic, most likely and pessimistic. When these values are substituted in the equation, we find the estimate of the activity as 9 days in triangular distribution.
Beta distribution was giving more weight to the most likely estimate by multiplying it with 4 during calculation. When we substitute the optimistic, most likely and pessimistic values of the activity, we find the beta distribution estimation as 8 days.
As you see from the results, beta distribution estimated activity duration is closer to the most likely estimate since beta distribution gives more weight to most likely estimate in the equation.
Standard deviation is found by dividing the difference of pessimistic and optimistic estimates to six. When we substitute the values in the equation, the result is 1.67 days.
And finally, activity ranges are defined with the help of estimated activity duration and standard deviation. For triangular distribution, activity range is 9 plus minus 1.67 days, and for beta distribution, activity range is 8 plus minus 1.67 days.
In this article, we explained each estimation technique and which estimation technique is advantageous for which kind of projects. Choosing the right estimation technique to estimate the durations of the activities, will be beneficial when estimating the overall project completion.

Review by: Mitchell Cook
One thought on “5 Alternatives for Choosing An Estimation Technique”
Comments are closed.