In an organization, there can be many potential projects, but to initiate each one of them is not the best option. There are project constraints that limit the execution of possible projects. So as defined in PMP training, the project selection methods come into use. The economic model options are the most common approach in the benefit measurement selection methods.
Benefit Measurement Methods also called Comparative Approach, assess the projects based on the benefits, profits or revenue. There are four types of approach:
- Murder board
- Peer review
- Scoring models
- Economic model
Attend our 100% Online & Self-Paced One-Hour Free PMP Training.
The economic model is the most important of these four types, as the economic model is used by the majority of companies who desire to perform a project initiation. In this article, we are going to explore the economic model for project selection and also illustrate the five options for using the economic model with the examples. In the PMP certification training, you would find further details about the types of the economic model.
Economic Model #1: Present Value
Present value is an economic model that calculates the present value of a money that will be paid or retrieved in future. That’s because a dollar today worth more than a dollar tomorrow; so there is time value of money.
Actually, the main theory on the background of this economic model is, if you have a money now, you can invest in different instruments. Like share of a company, interest etc. Therefore, if you invest your money in an instrument, you will have more money in future than you have now. If you will receive a money or pay money in future, today’s value of that amount will be lower.
And Present Value economic model calculates the today value of future cash flows. Generally, interest rates are used for calculating present value.
The formula of Present Value Economic Model:
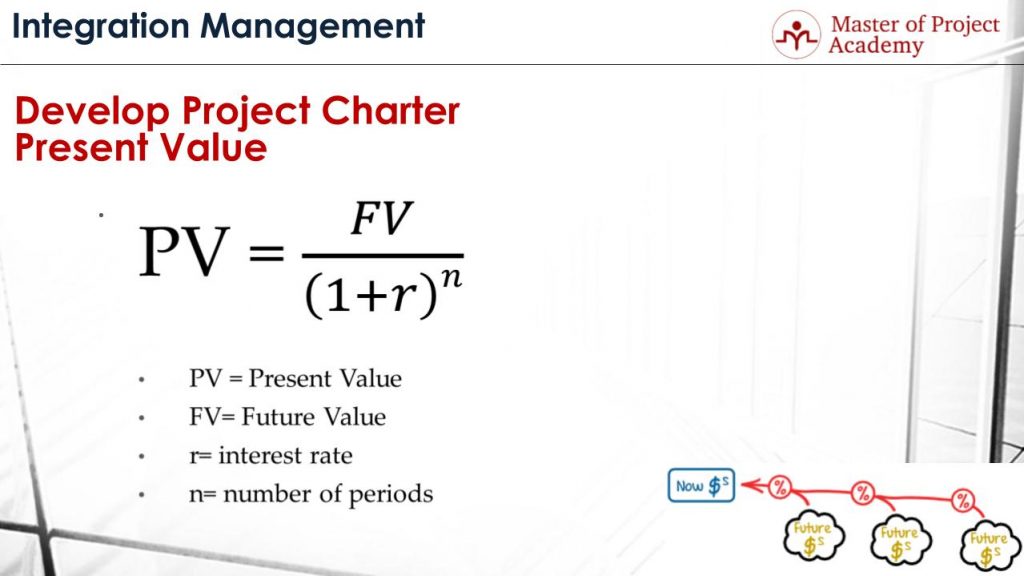
Present Value equals to the future value of the money divided by one plus interest rate over “n”. In this formula, PV stands for present value, FV stands for future value, r stands for interest rate and n stands for the number of periods.
Let’s go over a sample scenario to understand present value economic model better. Let’s assume that your project has three installments.
- 1st Installment: $100,000, that will be paid in the beginning of the project.
- 2nd Installment: $100,000, that will be paid at the end of 1st year.
- 3rd Installment: $100,000, that will be paid at the end of 2nd year.
The Interest Rate is 10% per year.
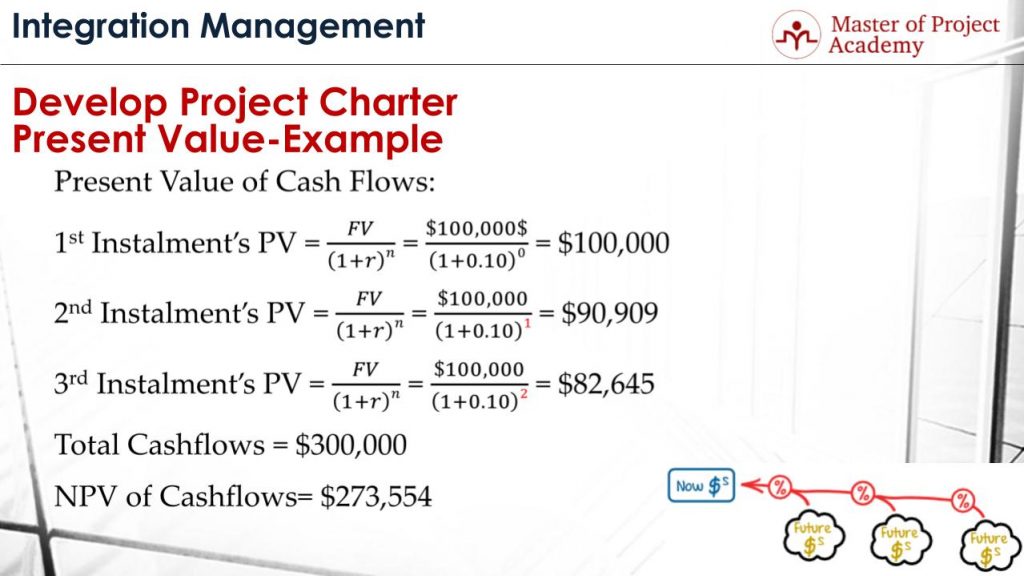
- Since 1st installment is paid at the beginning of the project, its present value will be same as its actual value.
- The second installment is paid at the end of the first year. If we substitute the future value, interest rate and the number of periods in the formula, we find that present value of the 2nd installment as $90,909.
- The third installment is paid at the end of 2nd year. If we substitute the values in the formula, we find that present value of the 3rd installment as $82,645.
Although total money that will be retrieved from the customer is $300,000 in total since it will be retrieved over time, present value, in other words, today’s value of these installments is $273,554.
Economic Model #2: Net Present Value
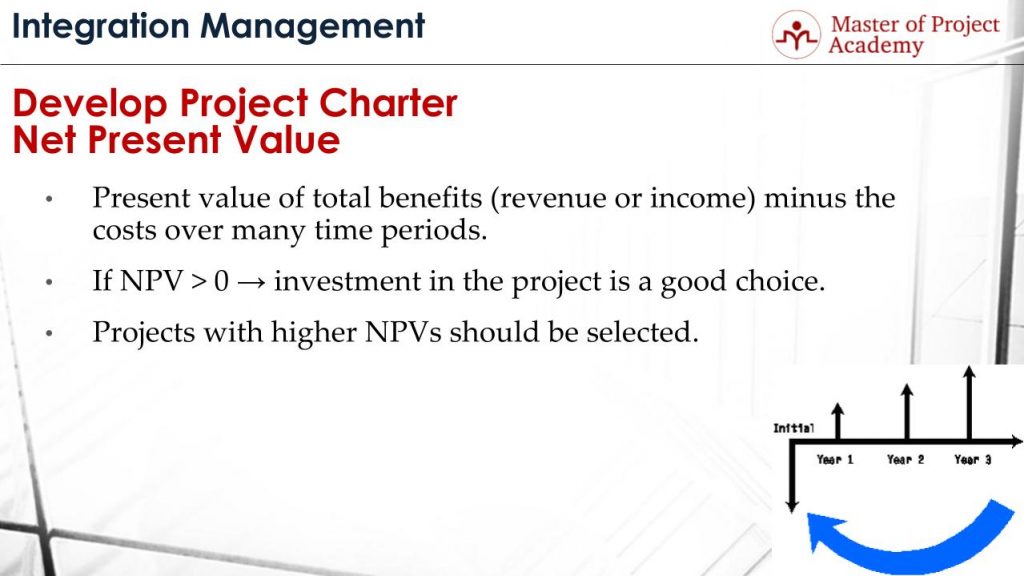
Net present value economic model uses present value calculations, calculates total inflows and outflows of a project to calculate net results. This economic model is described as the Present value of total benefits (revenue or income) minus the costs over many time periods. Net present value economic model is abbreviated as NPV.
If the Net present value of a project is greater than zero, this means the project will make a profit. Therefore, projects with NPV higher than zero must be selected.
If there are lots of projects on the agenda of the company, Projects with higher Net present values should be selected. Because higher net present value means higher profit.
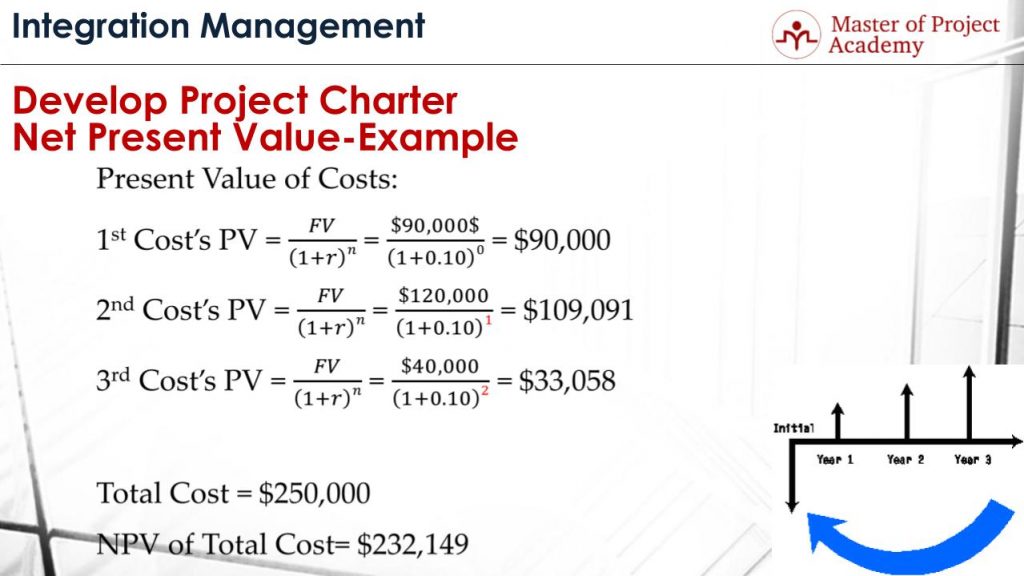
Consider our previous project example. And let’s assume that you will have following costs in this project.
- 1st Cost: $90,000, in the beginning of the project.
- 2nd Cost: $120,000, that will happen by the end of 1st year.
- 3rd Cost: $40,000, that will happen by the end of 2nd year.
The Interest Rate is 10%.
If we substitute these cost amounts in the present value formula,
- The present value of the 1st cost is same as its actual value: $90,000. Because it accrues immediately.
- The present value of the 2nd cost is $109,091.
- The present value of the 3rd cost is $33,058.
Although $250,000 will be spent as project cost throughout the project, net present value of these payments will be $232,149.
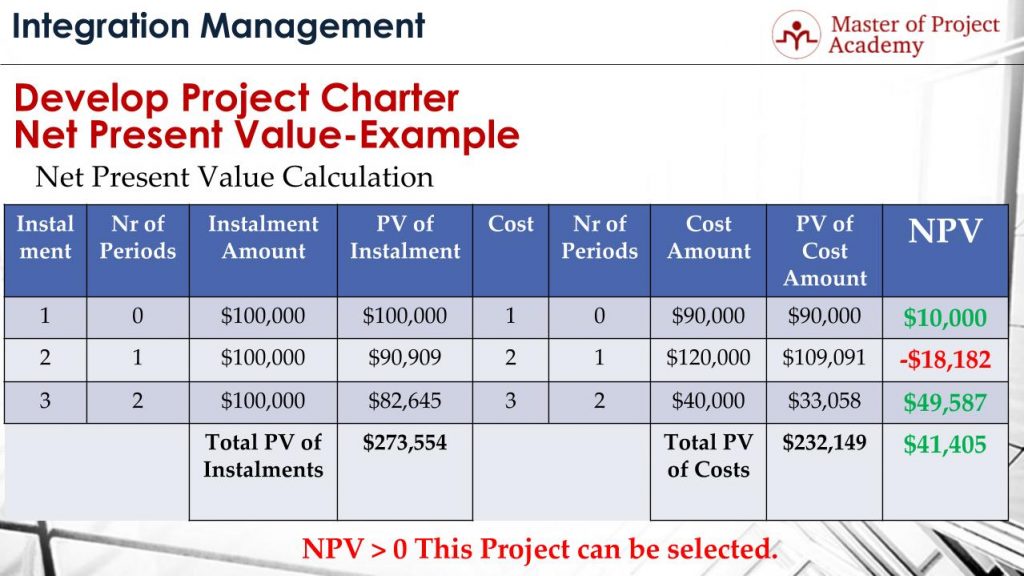
This table includes the present value of the installments that will be retrieved and present value of the project costs together.
- 1st installment’s net present value is greater than the cost at the beginning. In total, net present value is $10,000.
- 2nd Instalment’s present value is lower than the cost of that year. This results with -$18,182.
- 3rd installment’s present value is greater than the cost of last year. This returns a positive net present value as well.
If we sum up the net present value of all years, we find that while the project will receive $273,554, total cost that will be paid is $232,149. And this makes total net present value as $41,405.
Since the total net present value is greater than zero, this project is profitable and can be initiated.
Economic Model #3: Internal Rate of Return (IRR)
The internal rate of return is another economic model used in project selection. The internal rate of return economic model is abbreviated as IRR. This economic model explains how much percent a project will turn back. For instance, 12% of the investment will return in 2 years.
For instance, if $100,000 is needed for initiation of a project and if the internal rate of return is 12% in 2 years, this means the project will bring $12,000 profit by the end of 2nd year. In this economic model, the projects with higher IRR’s should be selected, as higher IRR means higher profit respectively.

Economic Model #4: Payback Period
Payback period is another economic model for project selection. Payback period is the number of time periods it takes to recover the investment of a project. Therefore Projects with shorter payback period should be selected in this economic model.
For instance, if a company invests 100.000$ for a project, and the payback period is 6 months. This means product or outcome of the project will bring 100.000$ in 6 months. Then it will start to make a profit.
The payback period is the duration of when the project will cover the investments made to complete the project.

Economic Model #5: Benefit-Cost Ratio
Benefit cost ratio is another economic model used for project selecting. This economic model estimates projects to determine what work should be done. An estimation of the benefits of the project is done in this economic model. Then, the benefits of the project are compared to the costs of the project. Here, the benefits can be considered as the revenue that will be gained from the outputs of the project.
- If it’s greater than 1, this means benefits of the project are more than the cost of the project.
- If it equals to 1, this means benefits of the project are equal to the cost of the project.
- If it’s lower than 1, this means benefits of the project are less than the costs of the project.
Therefore, the Projects with higher Benefit Cost Ratio should be selected in this economic model. Because this means revenue of the project or any other advantages that the project will bring are higher than the costs of the project. This will bring profitable or advantageous results respectively. If Benefit Cost Ratio is less than 1, the project should not be executed. Because the project will not generate profitable or advantageous results.
We have summarized the five types of the economic model, which is the most common approach among the project methods. To learn more about this important part of project integration management you can enroll in an online PMP training.
