
The Six Sigma approach to problem-solving is primarily data-driven. To obtain data in the Measure phase of the DMAIC process, it is important to understand sampling and the concept of a sample in statistics. It has very specific qualities. Lean Training Course and Green Belt training include a significant amount of information on the concept as well as sampling methods. This is because sampling is so important when collecting data for Six Sigma projects. Let’s take a look at taking a sample in statistics within the context of Six Sigma.
Sample in Statistics: An Introduction to Sampling
Sampling is very often used in our daily life. For example, while purchasing fruits from a shop, we usually examine a few to assess the quality. A doctor examines a few drops of blood as a sample and draws a conclusion about the blood constitution of the whole body. Thus, most of our investigations are based on samples. But what is a sample in statistics? This is something that is very important in Six Sigma – we need to understand what this means.
Attend our 100% Online & Self-Paced Free Six Sigma Training.
Sample in Statistics: The Process of Sampling
Sampling is the process of selecting units (e.g., people, organizations) from a population of interest so that by studying the sample we may fairly generalize our results back to the population from which they were chosen. Such is a sample in statistics.
The sampling of a sample in statistics works in the following manner:
- The first step is to define the population of interest
- The second step is to specify the sampling frame. The sampling frame is a set of events which are possibly measurable. In other words, it refers to the source material or device from which a sample is taken; it may include individuals, households, and institutions too
- The third step is to specify a sampling method
- The fourth step is to determine the sample size
- The fifth step is to implement the sampling plan or execute the sampling plan
- The sixth step is, to begin with the actual sampling and data collection
Taking a sample in statistics is an efficient and effective alternative to looking at all the data. Sampling a sample in statistics helps you to:
- Collect a portion of all the data
- Use that portion of the data to make conclusions
- Save on time, resources, and money
What is a Population?
To understand a sample in statistics we need to understand the concept of a population. What does population mean? In a statistical enquiry, all the items, which fall within the purview of enquiry are known as the population or universe. In other words, the population is a complete set of all possible observations of the type which is to be investigated. The total numbers of students studying in a school or college, the total number of books in a library, the total number of houses in a village or town are some of the examples of populations.
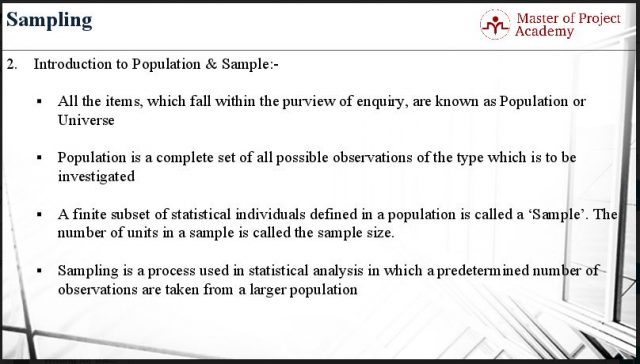
The word sample in statistics is used to describe a portion chosen from the population. A finite subset of statistical individuals defined in a population is called a sample in statistics. The number of units in a sample is called the sample size. Since it is generally impossible to study an entire population (every individual in a country, all college students, every geographic area, etc.), researchers typically rely on sampling to acquire a section of the population to perform an experiment or observational study. Sampling is a process used in statistical analysis in which a predetermined number of observations are taken from a larger population. Sampling provides a sample in statistics.
Representative Sampling
For the purpose of sampling, it is important that the sample selected be representative of the population, and not biased in a systematic manner. For example, a group comprised of the wealthiest individuals in a given area probably would not accurately reflect the opinions of the entire population in that area. Hence, randomization is typically employed to achieve an unbiased sample. Sampling methods are key to getting a correct sample in statistics.

Sample in Statistics: Sampling Error
As with anything in life, there is also room for error in the sampling of a sample in statistics. If you would analyze the whole population, there would be no sampling error. The first type of sampling error comes from the fact that the parameter that you measure in the sample would not be 100% the same as for the entire population. Furthermore, if you take a sample three times, the parameter would also be slightly different between the three samples. We call this the margin of error. This margin of error is unavoidable in collecting a sample in statistics.
The second type of error that can occur during sampling samples in statistics is the non-sampling error. These errors occur when the method of sampling is faulty. It can be due to faulty measurements or due to incorrect sampling methods that caused bias or due to mistakes in the data. These types of errors for collecting a sample in statistics will provide data that can’t be trusted. This is why it is very important that the sampling method that you use is trustworthy and that that the measuring tool that you use is trustworthy as well. This type of error can easily be avoided by following the correct sampling principles for obtaining a correct sample in statistics.
A sample in statistics is basically the group of subjects that Six Sigma teams will analyze to make assumptions about the population that they want to study. It is usually impossible to collect data from an entire population, which is why sampling is so important. There are many different sampling techniques, but these can be categorized broadly as probability sampling and non-probability sampling. But more on that later. The most important thing to know is that correct sampling procedures must be used to obtain a representative sample in statistics.